|
Top 10 IT Monitoring software
April 25, 2024 | Editor: Michael Stromann
19
IT infrastructure monitoring software allows IT administrators to view entire IT infrastructure in real-time. IT monitoring comprises a broad class of products designed to let analysts determine whether IT equipment is online and performing to expected service levels, while resolving any detected problems.
1
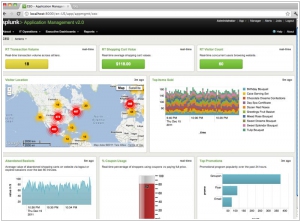
We make machine data accessible, usable and valuable to everyone—no matter where it comes from. You see servers and devices, apps and logs, traffic and clouds. We see data—everywhere. Splunk offers the leading platform for Operational Intelligence. It enables the curious to look closely at what others ignore—machine data—and find what others never see: insights that can help make your company more productive, profitable, competitive and secure.
2
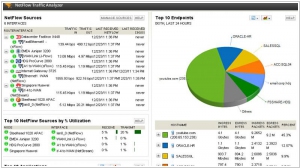
Monitor & manage your network with unified visibility into fault, performance, availability, traffic, & configurations. Get instant visibility across all system resources that can impact application performance and fix them fast. Find, analyze & resolve your toughest performance issues on SQL Server, Oracle, Sybase, and DB2. Automate 24x7 security monitoring and response to stop threats in their tracks and maintain continuous compliance.
3
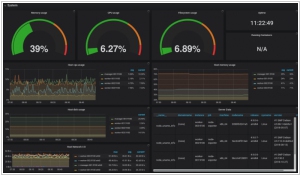
An open-source monitoring system with a dimensional data model, flexible query language, efficient time series database and modern alerting approach.
4
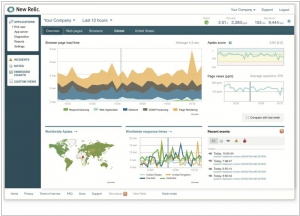
New Relic gets you immediate code-level visibility to build faster software, create better products, and delight your customers. New Relic gets you immediate code-level visibility to build faster software, create better products, and delight your customers.
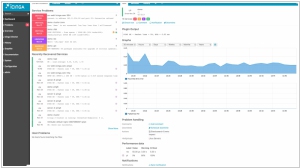
5
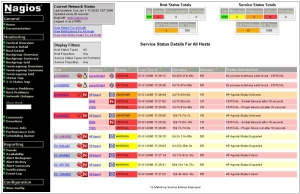
Nagios Is The Industry Standard In IT Infrastructure Monitoring. Achieve instant awareness of IT infrastructure problems, so downtime doesn't adversely affect your business. Nagios offers complete monitoring and alerting for servers, switches, applications, and services.
6
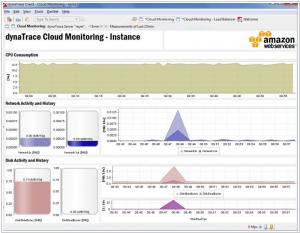
Cloud monitoring reinvented. Easy, Automatic, AI-Powered. Automatically monitor dynamic hybrid-cloud environments.
7
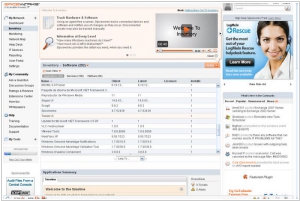
Spiceworks bundles network monitoring, helpdesk, UPS power management, PC inventory tools, an online community, and much more. All in one spot. All for free.
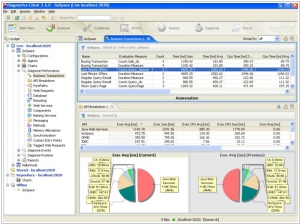
8
Zabbix is a mature and effortless enterprise-class open source monitoring solution for network monitoring and application monitoring of millions of metrics.
10
PRTG Network Monitor is an agentless network monitoring software. It can monitor and classify system conditions like bandwidth usage or uptime and collect statistics from miscellaneous hosts as switches, routers, servers and other devices and applications.
11
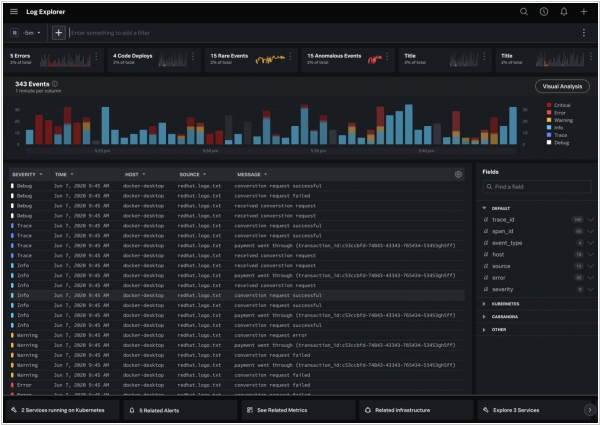
Datadog is a monitoring service for IT, Operations and Development teams who write and run applications at scale, and want to turn the massive amounts of data produced by their apps, tools and services into actionable insight.
12
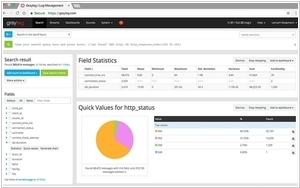
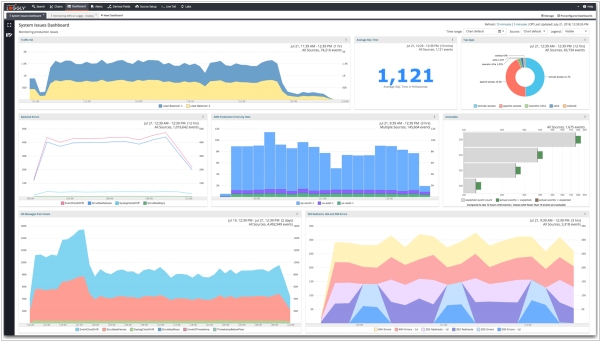
Graylog is a leading centralized log management solution for capturing, storing, and enabling real-time analysis of terabytes of machine data.
13
ManageEngine crafts comprehensive IT management software for all your business needs. We have complete and easy solutions for even your most difficult IT management problems, from keeping your business safe, to ensuring high availability, to making your users happy. We’re bringing IT together so you don’t have to.
14
CloudWatch collects monitoring and operational data in the form of logs, metrics, and events, providing you with a unified view of AWS resources, applications, and services that run on AWS and on-premises servers.
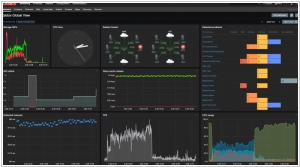
15
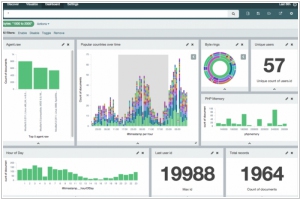
ELK is the acronym for three open source projects: Elasticsearch, Logstash, and Kibana. Elasticsearch is a search and analytics engine. Logstash is a server‑side data processing pipeline that ingests data from multiple sources simultaneously, transforms it, and then sends it to a "stash" like Elasticsearch. Kibana lets users visualize data with charts and graphs in Elasticsearch.
16
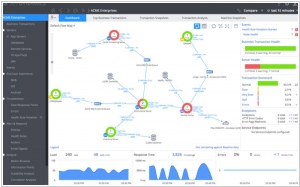
Cisco's AppDynamics is an application performance management and IT operations analytics software. Get real-time insights and transform your app performance with our Application Performance Management to drive business outcomes.
17
Kaseya helps MSPs and IT Departments better manage their business with our IT management software suite, IT Complete.
18
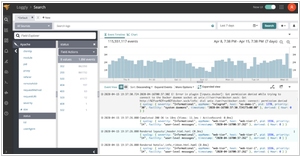
Solve Operational Problems Faster. Make all of your logs accessible to everyone in one place. No more logging into individual machines. Use searches, filters and graphs to spot trends and narrow down potential root causes. Set up in minutes. No software or agents to install. Works with all standard logging facilities. Owned by SolarWinds.
19
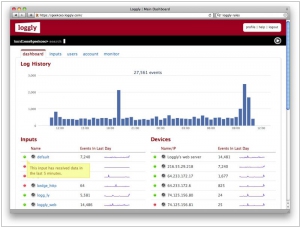
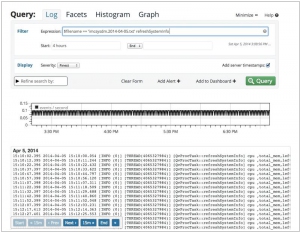
logstash is a tool for managing events and logs. You can use it to collect logs, parse them, and store them for later use (like, for searching). Speaking of searching, logstash comes with a web interface for searching and drilling into all of your logs.
20
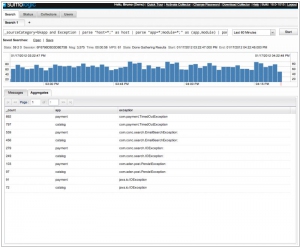
Sumo Logic cloud log management solution processes ALL your production application logs and server log data, analyzes them in real-time and delivers actionable results at a fraction of the cost of on-premise solution.
22
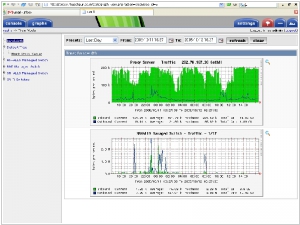
Cacti is an open-source, web-based network monitoring and graphing tool designed as a front-end application for the open-source, industry-standard data logging tool RRDtool. Cacti allows a user to poll services at predetermined intervals and graph the resulting data.
23
OpenNMS is a free and open-source enterprise grade network monitoring and network management platform.
24
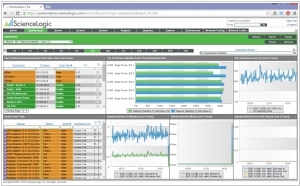
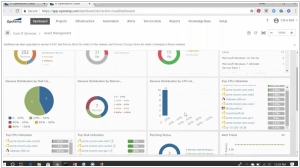
ScienceLogic’s solution is an all-in-one IT monitoring software product, comprehensive and complete in a single, unified platform. Unlike some companies, we do not sell you a la carte, piecemeal selections. To help you understand the many powerful components of our solution, we have broken out descriptions of features and capabilities that other companies call (and sell) as individual products:
25
syslog-ng is the foundation of log collection and management. Optimize your SIEM, meet compliance requirements, and deliver data from a variety of sources.
26
Server Log Monitoring Tool. We built the log monitoring tool we've always wished for. Scalyr is server log monitoring and analysis built for engineers. Turn chaotic logs and system metrics into actionable data.
27
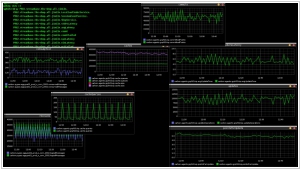
Graphite is an enterprise-ready monitoring tool that runs equally well on cheap hardware or Cloud infrastructure. Teams use Graphite to track the performance of their websites, applications, business services, and networked servers. It marked the start of a new generation of monitoring tools, making it easier than ever to store, retrieve, share, and visualize time-series data.
28
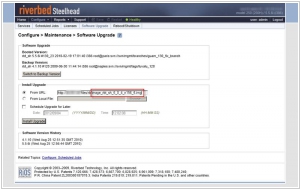
The Riverbed Network and Application Performance Platform enables organizations to visualize, optimize, accelerate and remediate the performance of any network for any application.
29
Network performance monitoring that goes beyond your network. AppNeta provides real-time, actionable insight from remote offices, over internal networks, and across the internet, so you can quickly get to the bottom of performance issues regardless of where they occur.
30
One platform, unlimited metrics. Monitoring Zen. We get your data flowing to us from anywhere, whether it's through our API, a turn-key solution, or one of our many open source collection agents. Turn your raw data into intuitive metrics with our powerful composite metric defi-nitions. Owned by SolarWinds.
31
OpsRamp is a service that helps IT teams discover, monitor, manage and automate their hybrid environments
32
Logit centralises and manages your logs and metrics. Automation, Analysis and Alerting built on ELK
Latest news about IT Monitoring software
2023. Cisco to acquire IT Monitoring giant Splunk for $28B
Cisco has announced that it is acquiring Splunk for $28 billion. This acquisition is strategically aligned with Cisco's security-focused business, as it gains access to Splunk's observability platform. This addition will enable Cisco to enhance its ability to assist customers in comprehending security threats while also providing valuable capabilities for analyzing extensive log data to address various challenges such as understanding system failures and troubleshooting a wide range of issues across enterprise systems. It's important to note that both company boards have already given their approval for the acquisition. However, it must undergo regulatory approval, which is not guaranteed due to the heightened scrutiny that such deals are encountering worldwide.
2023. New Relic launches Grok, its AI observability assistant
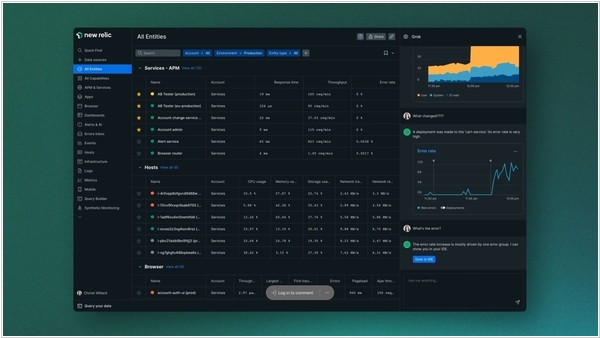
Enterprises and related companies are currently in the midst of integrating large language models into their services. New Relic has announced its own offering Grok, which it claims is the first generative AI assistant for observability. The aim is to leverage a large language model to assist engineers in performing routine tasks within New Relic, such as setting up instrumentation, creating reports, and managing accounts using natural language. The use of these models provides a significant advantage in helping engineers analyze the large amounts of data collected by the service, which is crucial not only for ensuring the performance of a given service but also for managing its associated costs - an increasingly important concern for most enterprises.
2022. New Relic enters the security market with its new vulnerability management service
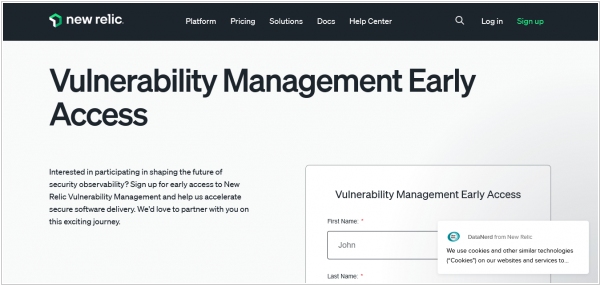
New Relic, renowned for its observability platform, has ventured into the security market by unveiling a new vulnerability management service. Aptly named New Relic Vulnerability Management, this service consolidates data from both New Relic's native vulnerability detection system and third-party tools. It offers a unified solution for security, DevOps, SecOps, and SRE teams to monitor their software stack for vulnerabilities. The company emphasizes that one of its key advantages is the seamless integration with third-party security tools. This capability enables teams to prioritize security risks effectively, considering the overwhelming number of potential risks, and the service assists in identifying the necessary actions to address and mitigate these risks.
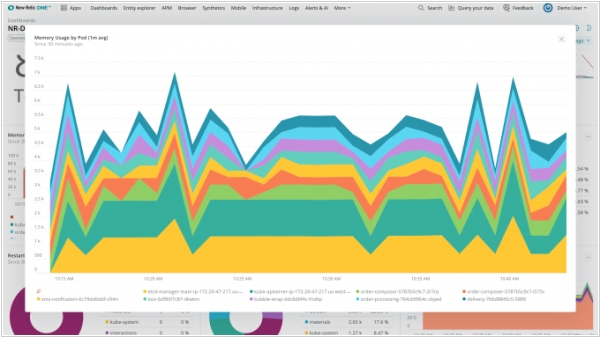
2022. New Relic launches its new infrastructure monitoring experience
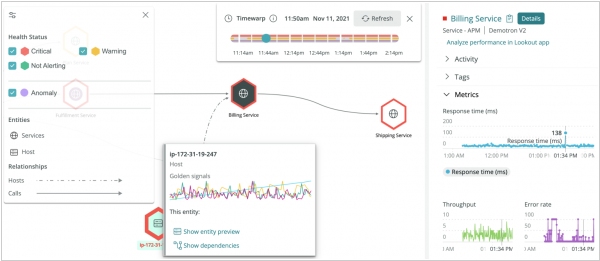
In the year 2020, New Relic introduced its New Relic One platform, aiming to consolidate the various individual solutions developed by the company over the years into a unified framework. Building upon this foundation and leveraging its NRDB data storage system, New Relic enhanced its offerings by incorporating advanced features such as enhanced network monitoring, a tool for monitoring and tracking ML model performance, and error tracking capabilities. Today, the company is finalizing one of the remaining components of this initiative by making its new infrastructure monitoring experience widely available. This solution is specifically designed to assist DevOps, SRE, and ITOps teams in monitoring their infrastructure and promptly resolving issues across public, private, and hybrid cloud environments. New Relic users can now access this new solution.
2021. ControlUp nabs $100M to monitor and improve desktop computing performance
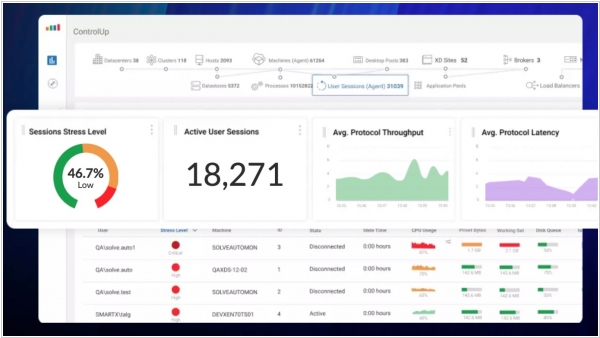
IT performance monitoring and improvement technology provider ControlUp has secured $100 million in funding to further enhance its tools and expand its customer base. ControlUp's solution revolves around the deployment of background "agents" on users' computers, continuously monitoring the performance of applications and devices. These AI-powered agents not only detect issues like slow broadband networks but also offer remedial actions through automated or manual technical suggestions. This allows both individuals and remote IT personnel to effectively address specific issues as they arise. With the new funding, ControlUp aims to invest in product development and bolster its business operations.
2021. Cribl raises $200M to help enterprises do more with their data
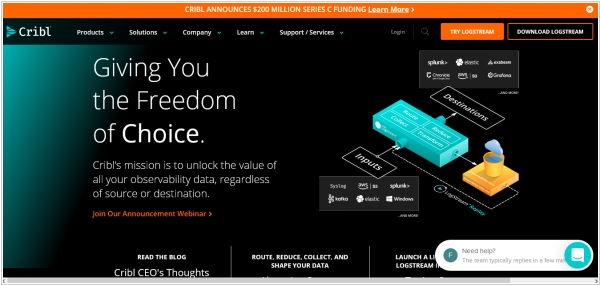
Cribl, a company that is revolutionizing enterprise data management with its "open ecosystem of data," has secured a remarkable $200 million in Series C funding. Cribl's innovative approach involves utilizing unified data pipelines, known as "observability pipelines," to effectively process and direct various types of data flowing through an organization's IT infrastructure. The beauty of Cribl lies in its ability to empower users to select their preferred analytics tools and storage destinations, such as Splunk, Datadog, and Exabeam, without being locked into a single vendor's solution. Moreover, Cribl gives customers the freedom to choose how they store their data, setting it apart from competitors who often restrict companies to their proprietary offerings. By enabling seamless communication between different products, Cribl allows organizations to assemble the best-in-class solutions from various categories, fostering a truly interconnected data ecosystem.
2021. CrowdStrike acquires logging startup Humio for $400M
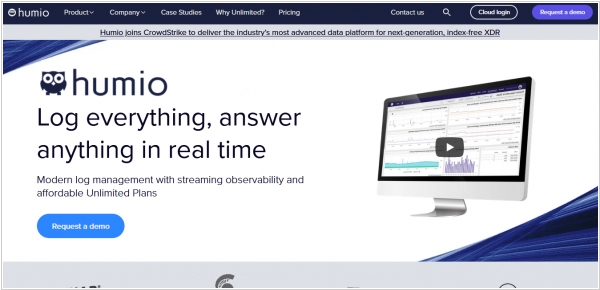
CrowdStrike, an enterprise-focused cloud-native cybersecurity company specializing in endpoint protection and threat intelligence, has revealed its intention to acquire Humio, a log analysis and observability startup based in the United Kingdom. The deal, primarily conducted through cash transactions, is estimated to be valued at around $400 million. Humio gained recognition in the realm of cloud log-management and observability since its establishment in 2016 in London. The company has distinguished itself through its innate capability to ingest and analyze both unstructured and semi-structured data. Backed by investors like Accel and Dell, Humio has secured over $30 million in funding, while serving prominent customers such as Microsoft and Bloomberg.
2021. SentinelOne to acquire high-speed logging startup Scalyr for $155M
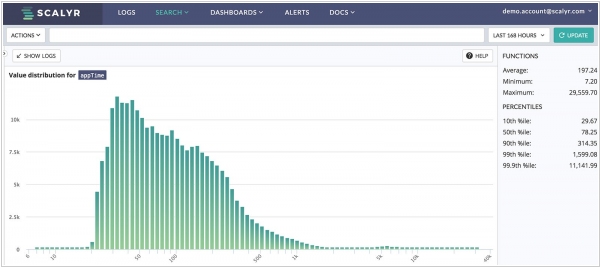
SentinelOne, an advanced-stage security startup that leverages AI and machine learning to assist customers in interpreting security data, has completed the acquisition of high-speed logging startup Scalyr for $155M. SentinelOne's expertise lies in analyzing vast amounts of data to provide customers with insights into their security posture. Therefore, the addition of Scalyr, a tool that facilitates rapid data iteration and root cause analysis for engineers, holds immense value for the company. While SentinelOne intends to integrate Scalyr into its platform, it also recognizes the significance of maintaining it as a standalone product. This acquisition enhances SentinelOne's capabilities and bolsters its commitment to delivering comprehensive security solutions to its clientele.
2021. Employee IT Experience monitoring provider Nexthink nabs $180M
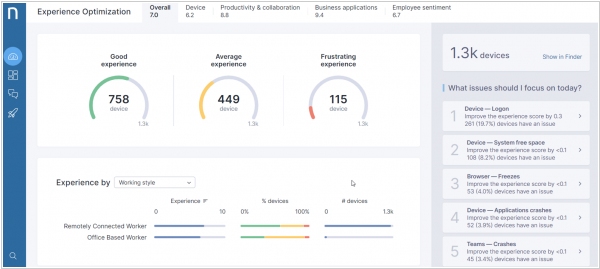
Nexthink, a well-established startup aiming to enhance IT services for internal clients, has recently secured a $180 million Series D funding. Nexthink approaches the IT monitoring challenge from a unique standpoint by providing the IT department with real-time insights into the employee experience of IT services. Similar to how HR and marketing survey tools enable companies to gauge the satisfaction of employees or customers, Nexthink enables querying of the user base. By collecting this valuable data, it enables IT departments to comprehend how employees are utilizing the organization's chosen technology solutions. This software is tailored towards larger organizations with a minimum of 5,000 employees.
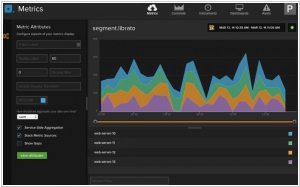
2021. Chronosphere nabs $43M to expand cloud native monitoring tool
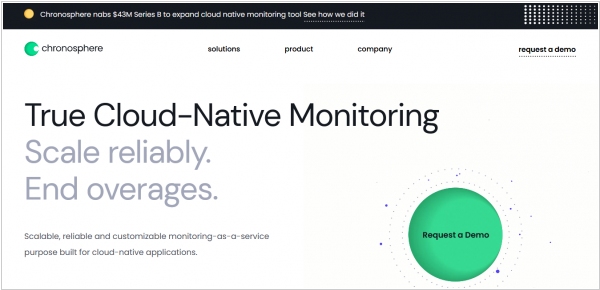
Chronosphere, the cloud-native monitoring tool known for its scalability, has successfully raised $43.4 million in its Series B funding round and announced the general availability of its service. The founders of the startup initially created the open-source M3 monitoring project in 2019, which served as the foundation for Chronosphere. The M3 project itself addresses complex monitoring challenges at a large scale, requiring substantial investment to operate effectively. Chronosphere's primary focus has been on managing and optimizing the M3 technology to enable efficient large-scale operations. Throughout the previous year, the company dedicated its efforts to iterating on the product and collaborating with beta customers. Leveraging the open-source project as the basis for their commercial service has proven to be advantageous for Chronosphere's development and growth.
2020. New Relic acquires Kubernetes observability platform Pixie Labs
New Relic, a publicly traded company specializing in monitoring and observability platforms, has completed the acquisition of Pixie Labs, a Kubernetes observability platform. Despite the acquisition, Pixie Labs will retain its brand and product, enabling New Relic to expand its platform capabilities to the edge. Pixie Labs initially focused on offering observability for cloud-native workloads operating on Kubernetes clusters. While most similar tools cater to operators and IT teams, Pixie Labs aimed to develop a tool specifically tailored for developers' preferences. By utilizing eBPF, a relatively recent method of extending the Linux kernel, the Pixie platform can gather data directly from the source without requiring an agent.
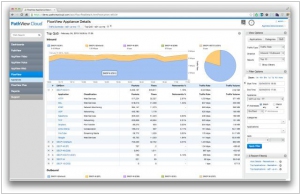
2020. Splunk acquires network observability service Flowmill
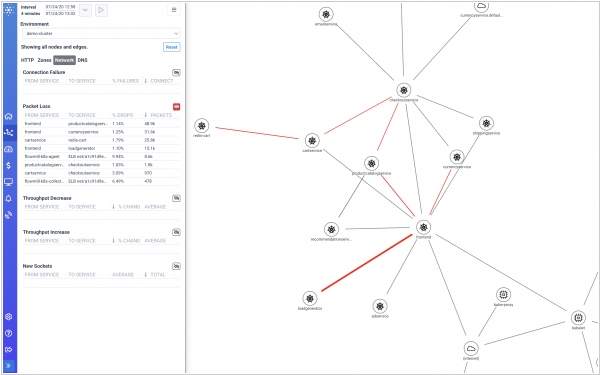
Data platform Splunk continues its acquisition streak as it expands its newly launched observability platform. Following the recent acquisitions of Plumbr and Rigor, the company has now announced the acquisition of Flowmill, a network observability startup based in Palo Alto. Flowmill specializes in helping users identify real-time network performance issues within their cloud infrastructure and offers traffic measurement by service to enable cost control. Similar to other players in this field, Flowmill leverages eBPF, a Linux kernel feature that allows the execution of sandboxed code without the need for kernel modification or loading kernel modules. This capability makes it particularly well-suited for application monitoring.
2020. Splunk acquires Plumbr and Rigor to build out its observability platform
Data platform Splunk has recently made two acquisitions, namely Plumbr and Rigor, in order to enhance its newly launched Observability Suite. Plumbr specializes in application performance monitoring, while Rigor focuses on digital experience monitoring. Through synthetic monitoring and optimization tools, Rigor assists businesses in optimizing their end-user experiences. These acquisitions serve as valuable additions to the technology and expertise gained by Splunk through its acquisition of SignalFx for over $1 billion last year.
2020. Coralogix lands $25M Series B to rethink log analysis and monitoring
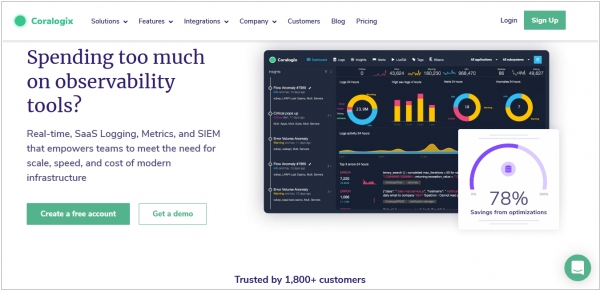
Logging and monitoring often incur significant expenses due to the vast volume of data involved. Consequently, companies face the challenge of selectively choosing what to monitor, limiting their visibility. Coralogix aims to revolutionize this landscape by introducing a more flexible pricing model. Today, the company has announced a $25 million Series B funding round and unveiled a real-time analytics solution called Streama. This solution empowers companies to customize their monitoring approach and pay exclusively for the features they utilize. By assigning lower priority to less crucial logs, customers can optimize their budget and allocate resources to more important areas. Coralogix stands out from competitors like Splunk, Datadog, and Sumo Logic by offering a modern approach that simplifies operations while addressing this challenge.
2020. New Relic is changing its pricing model to encourage broader monitoring
In the field of monitoring, it's common practice to incur fees for monitoring each new instance. This approach can result in significant costs if you have a high level of activity within a month. As a result, many organizations choose to limit their monitoring scope to manage expenses. However, New Relic aims to revolutionize this paradigm by introducing a user-based payment model that includes a smaller, more affordable data component. In addition, the company is streamlining its product offerings to encourage customers to monitor everything instead of selectively choosing what to monitor based on cost considerations. By adopting this approach, organizations can gain comprehensive insights without worrying about exorbitant monitoring bills.
2020. Log management platform Logit improves its performance
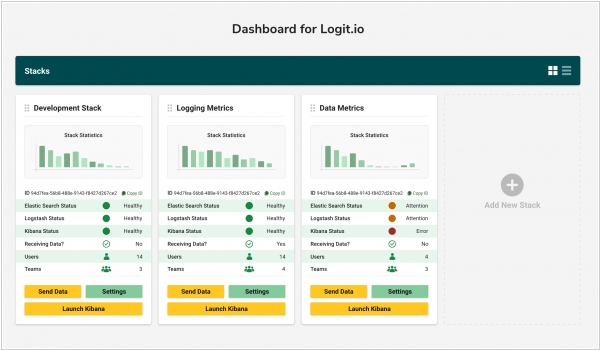
The widely used log management and analysis platform, Logit, has recently announced the implementation of their enhanced infrastructure backed by NVMe (Non-Volatile Memory Express) SSDs for all Elastic Stacks hosted on their platform. Recognizing that numerous enterprise-level organizations have yet to leverage the advantages of NVMe for faster and more efficient log data management and analysis, Logit is delighted to offer this improvement to both new and existing users. NVMe represents one of the latest high-performance networking technologies that is transforming the landscape of scalable infrastructure and significantly reducing infrastructure costs. This enhancement is part of Logit's ongoing commitment to improving their platform and is provided to all users at no additional cost, starting from the end of June 2020.
2020. Cisco grabs ThousandEyes for network-intelligence technology
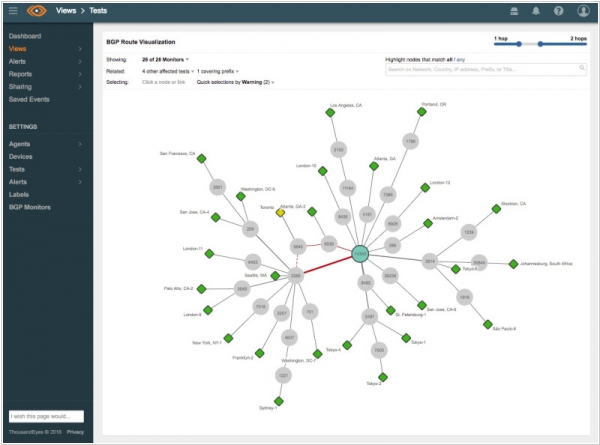
Cisco has completed the acquisition of ThousandEyes, a provider of network intelligence software, for a staggering $1 billion. ThousandEyes specializes in a cloud-based software suite that assesses the performance of both local and wide-area networks, as well as the internet. Through its extensive global network insights, the company also monitors the performance of internet service providers (ISPs), cloud platforms, and collaboration applications, employing a range of intelligent cloud, enterprise, and endpoint agents. Cisco has expressed its vision of integrating ThousandEyes technology into various products, such as AppDynamics application performance, SD-WAN, WebEx, and Meraki families. This integration aims to enhance visibility across the enterprise, internet, and the cloud, delivering an improved user experience.
2020. Kentik raises $23.5M for its network intelligence platform
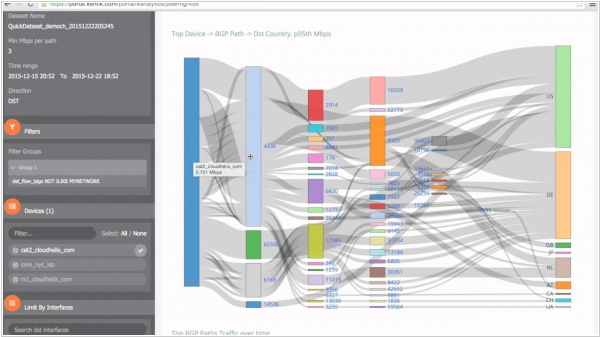
Kentik, formerly known as CloudHelix, has recently secured a funding round of $23.5 million. This company offers a platform that enables enterprises to monitor their networks, whether they are connected through the internet, within their own data centers, or in public clouds. Since its inception in 2015, Kentik has experienced a compounded annual growth rate of 100% and currently serves customers in 25 countries. Its customer base includes prominent enterprises, SaaS companies, content providers, gaming companies, and cloud and communication service providers. Notable customers of Kentik consist of IBM, Zoom, Dropbox, eBay, Cisco, and GoDaddy.
2020. Gartner named 15 top application performance monitoring vendors
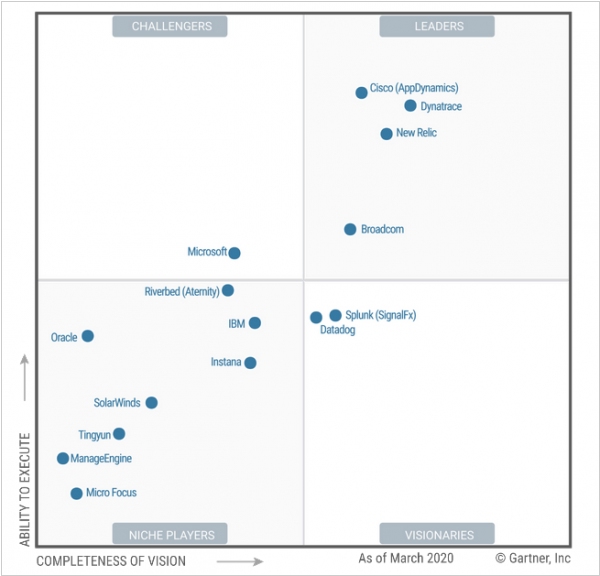
According to Gartner, Application Performance Monitoring (APM) vendors are enhancing their capabilities to forecast the impact of application performance on digital business, while also offering greater support for cloud infrastructure. The COVID-19 pandemic has posed challenges for enterprises in maintaining the performance of business-critical applications and ensuring a satisfactory digital experience for their users. Gartner suggests that addressing these issues necessitates the utilization of digital experience monitoring (DEM) products, several of which are featured in Gartner's Magic Quadrant. These solutions can be deployed either at the locations where employees are situated or as cloud-based APM offerings, enabling comprehensive visibility and the achievement of performance objectives.
2020. Checkly raises $2.25M for its monitoring and testing platform for DevOps teams
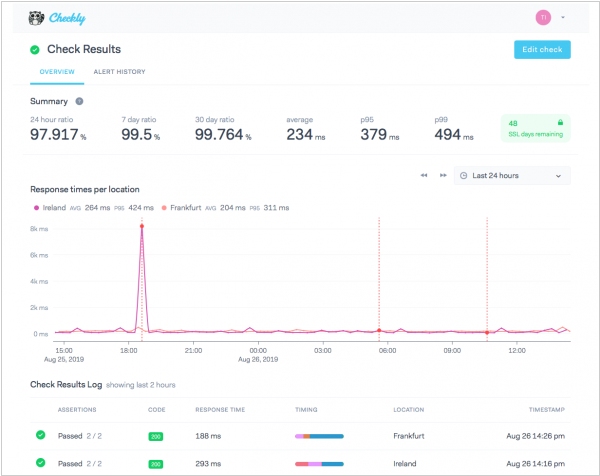
Checkly, a startup based in Berlin, has successfully raised $2.25 million in seed funding. The company is focused on developing a monitoring and testing platform specifically designed for DevOps teams. Checkly's Software-as-a-Service (SaaS) platform empowers developers to monitor their API endpoints and web applications effectively. Notably, it provides timely alerts whenever any issues arise. The transaction monitoring tool simplifies the process of regularly testing interactions with front-end websites, eliminating the need for manual code writing. Leveraging Google's open-source Puppeteer framework, Checkly has built its commercial platform. Additionally, the company has developed Puppeteer Recorder, a low-code tool in the form of a Chrome extension, enabling developers to create end-to-end testing scripts effortlessly.
2020. Humio raises $20M to advance unlimited logging tool
Humio, a startup specializing in developing a modern, unlimited logging solution, has announced a $20 million investment in a Series B funding round. Humio aims to provide companies with a logging solution that allows them to log everything, while simultaneously reducing the associated costs—a challenge given the extensive resources and data volumes involved. The company caters to customers dealing with the processing of multiple terabytes of data on a daily basis. Furthermore, by enabling companies to log everything rather than selectively choosing what to log, Humio empowers them to ask questions about unknown aspects, such as ongoing security incidents or major outages, and obtain real-time answers from the logged data.
2020. OpsRamp raises $37.5M for its hybrid IT operations platform
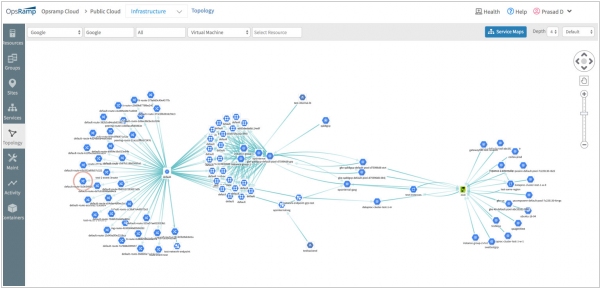
OpsRamp, a platform designed to assist IT teams in discovering, monitoring, managing, and automating their hybrid environments, has successfully concluded a funding round, raising $37.5 million. At the heart of OpsRamp's offerings is its AIOps platform, which leverages machine learning and other advanced techniques to help IT teams effectively handle intricate infrastructure deployments. By providing intelligent alerting and progressively automating tasks, OpsRamp aims to simplify IT operations in the face of increasing complexity. Additionally, the company's product portfolio encompasses cloud monitoring and incident management tools, enhancing its comprehensive suite of IT management solutions.
2019. Splunk acquired cloud AIOps service SignalFx

Splunk, the data processing and analytics company, has completed the acquisition of SignalFx for an estimated amount of $1.05 billion. SignalFx specializes in real-time cloud monitoring solutions, predictive analytics, and other related services. This acquisition is expected to enhance Splunk's position in the cloud sector, enabling it to provide stronger support for cloud-native applications and modern infrastructures and architectures they depend on. By integrating SignalFx, Splunk aims to offer customers a comprehensive platform capable of monitoring the complete lifecycle of enterprise applications.
2019. Sumo Logic raises $110 million to orchestrate cloud apps with AI
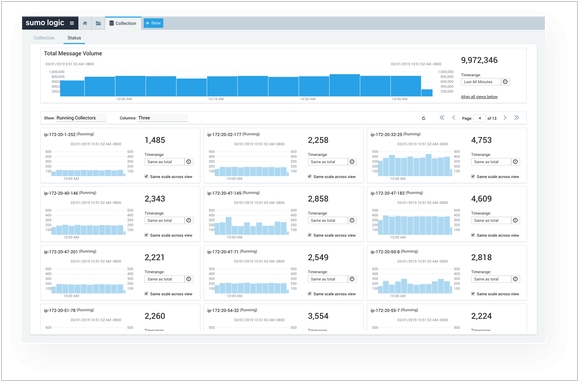
Sumo Logic, a cloud-native platform specializing in machine data analytics and delivering continuous app intelligence, has successfully raised $110 million in a series G funding round. This substantial investment comes on the heels of a remarkable year for Sumo Logic, during which it achieved over $100 million in revenue and surpassed the milestone of 2,000 customers. With a valuation exceeding $1 billion and a workforce of over 500 employees, Sumo Logic boasts an impressive client roster that includes renowned names such as Airbnb, Pinterest, and The Pokémon Co. Offering a wide range of analytics and insights across 150 apps and integrations, Sumo Logic supports clients in building, operating, and securing their applications and cloud infrastructures. The newly acquired funds will be utilized to expand Sumo Logic's engineering, sales, and global operations teams, with a primary focus on enhancing the platform's analytics capabilities across its diverse suite of services.
2019. Zabbix 4.2 adds built-in support of Prometheus data collection
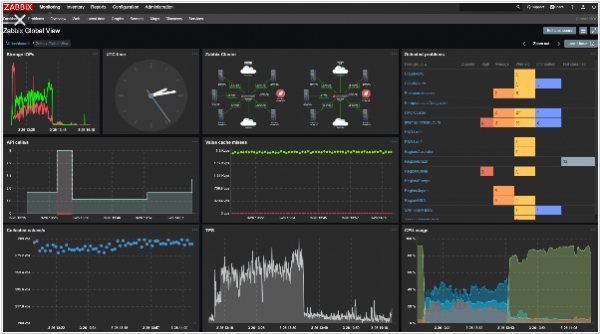
Zabbix Team has recently unveiled the launch of Zabbix 4.2. This latest version introduces a comprehensive monitoring system equipped with cutting-edge features, including data collection and processing, distributed monitoring, real-time problem and anomaly detection, alerting and escalations, visualization, and more. Zabbix 4.2 significantly enhances data collection capabilities, supporting diverse methods such as push and pull from various sources like JMX, SNMP, WMI, HTTP/HTTPS, RestAPI, XML Soap, SSH, Telnet, agents, scripts, and more. Notably, the integration with Prometheus has been added as a new feature, allowing native support for the PromQL language. Additionally, the utilization of dependent metrics empowers the Zabbix team to efficiently gather a vast amount of Prometheus metrics. By making a single HTTP call, all the required data can be retrieved and subsequently reused for relevant dependent metrics.
2018. Google Cloud adds new applications performance monitoring tool
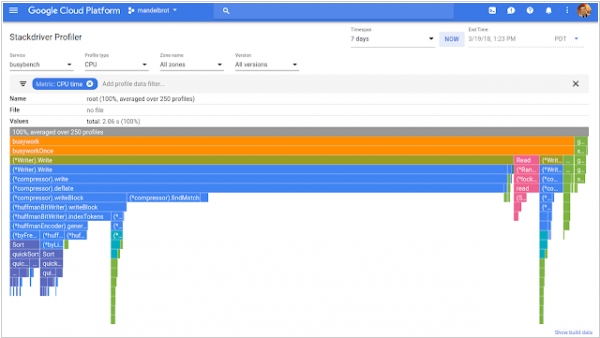
Google has introduced a significant addition for developers working on applications within the Google Cloud Platform. They now have access to a comprehensive suite of application performance management tools known as Stackdriver APM. This suite empowers developers to directly track and address issues within the applications they have built, eliminating the need to rely solely on operations teams. The underlying idea is that developers, being intimately familiar with the code, are best positioned to comprehend the signals emanating from it. Stackdriver APM consists of three primary tools: Profiler, Trace, and Debugger. While Trace and Debugger were already available, the integration of Profiler allows all three tools to seamlessly collaborate in identifying, monitoring, and resolving code-related issues.
2018. SolarWinds acquires log-monitoring service Loggly
SolarWinds, an IT management company, has recently completed the acquisition of the cloud-based log-monitoring and analytics service, Loggly. Loggly's marketing materials highlight that a significant portion of the Fortune 500, including renowned companies like Lenovo, Pizza Hut, and Dell, utilize their services. SolarWinds states that this strategic acquisition will expand their engineering and analytics expertise, contributing to the development of a comprehensive monitoring platform. Despite its history of acquiring various companies, including Pingdom, SolarWinds intends to maintain the Loggly brand and product as an ongoing entity.
2017. Splunk expands machine learning capabilities across platform

Cloud monitoring provider Splunk is bolstering its machine learning capabilities to facilitate the identification of critical data. The Splunk Machine Learning Toolkit introduces several new features specifically designed for those who prefer a do-it-yourself approach. Firstly, a new data cleaning tool has been implemented to prepare the data for modeling. Additionally, machine learning APIs have been introduced, enabling the importation of both open-source and proprietary algorithms for application within Splunk. Lastly, a machine learning management component allows for seamless integration of user permissions from Splunk into customized machine learning applications. For users seeking a more automated experience, Splunk offers new features such as Splunk ITSI 3.0. Leveraging machine learning, this tool assists in issue identification and prioritization based on the criticality of each operation to the business. These advancements empower users to derive meaningful insights from their data while tailoring the level of involvement according to their preferences.
2017. Cisco aquired application performance management software AppDynamics
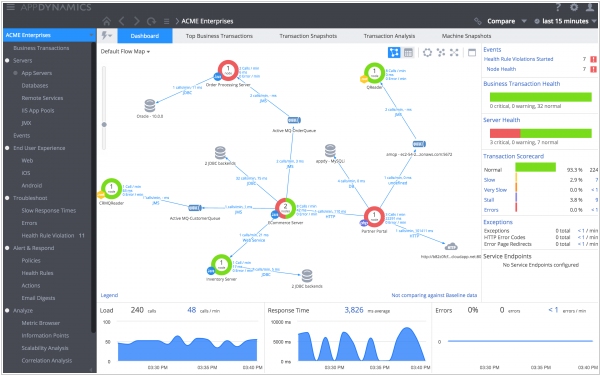
Cisco has made a significant acquisition by purchasing AppDynamics for a remarkable $3.7 billion. AppDynamics specializes in providing performance monitoring solutions for business applications, allowing customers to gain valuable insights into the inner workings of their applications. This comprehensive overview enables companies to effectively identify bottlenecks and performance issues that may hinder transactions and other actions. The primary objective is to detect and address potential issues before they escalate into major problems, sparing companies significant headaches. With this acquisition, Cisco further expands its range of offerings and provides companies with a more comprehensive stack of tools to support their business operations.
2016. Splunk unveiled 300 machine learning algorithms for Operational Intelligence
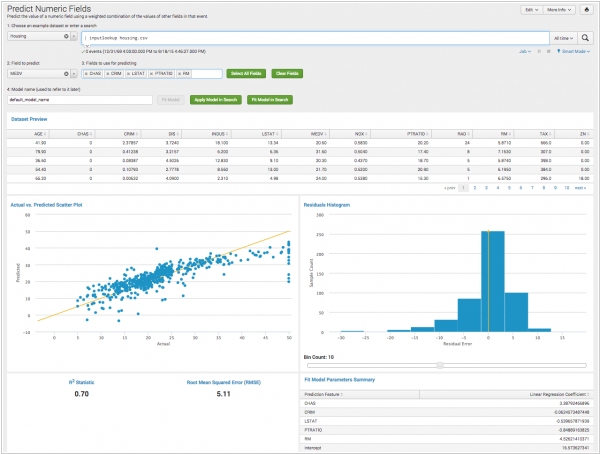
Splunk, a leading provider of Operational Intelligence platforms, has made significant advancements in incorporating machine learning capabilities into its platform, thereby expanding its range of services and capabilities. The company has integrated machine learning at the core of its platform through the introduction of a machine learning toolkit, which can be installed as a complimentary app on top of the Splunk Enterprise platform. This toolkit offers users access to a comprehensive set of 300 machine learning algorithms, with 27 of them conveniently pre-packaged and ready to use. These algorithms cover various categories such as clustering, recommendations, regression, classification, and text analytics. Furthermore, Splunk has enhanced its machine learning functionality within the IT Service Intelligence (ITSI) platform, which was initially introduced a year ago.