|
New Relic vs Prometheus
May 17, 2023 | Author: Michael Stromann
22
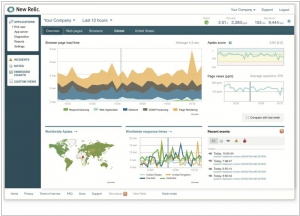
New Relic gets you immediate code-level visibility to build faster software, create better products, and delight your customers. New Relic gets you immediate code-level visibility to build faster software, create better products, and delight your customers.
24
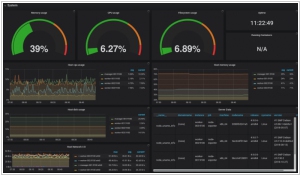
An open-source monitoring system with a dimensional data model, flexible query language, efficient time series database and modern alerting approach.

See also:
Top 10 IT Monitoring software
Top 10 IT Monitoring software
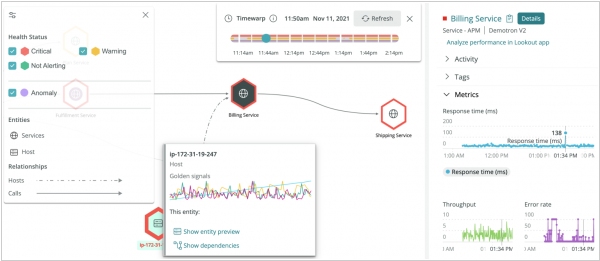
New Relic and Prometheus are both popular monitoring and observability tools, but they have distinct differences in terms of architecture, features, and ecosystem. New Relic is a comprehensive application performance monitoring (APM) solution that offers end-to-end visibility into the performance and health of applications. It provides real-time monitoring, alerting, and analytics capabilities, with a user-friendly interface and a wide range of integrations. New Relic is known for its ease of use and out-of-the-box functionality, making it suitable for organizations that prioritize quick setup and robust APM features. Prometheus, on the other hand, is an open-source monitoring system that focuses on time-series data collection and analysis. It is highly scalable and designed for monitoring dynamic and cloud-native environments. Prometheus offers powerful querying and alerting capabilities, along with a flexible data model and extensive support for exporters and integrations. It is favored by organizations that require deep customization and have specific needs for infrastructure and application monitoring.
See also: Top 10 IT Monitoring software
See also: Top 10 IT Monitoring software
New Relic vs Prometheus in our news:
2023. New Relic launches Grok, its AI observability assistant
Enterprises and related companies are currently in the midst of integrating large language models into their services. New Relic has announced its own offering Grok, which it claims is the first generative AI assistant for observability. The aim is to leverage a large language model to assist engineers in performing routine tasks within New Relic, such as setting up instrumentation, creating reports, and managing accounts using natural language. The use of these models provides a significant advantage in helping engineers analyze the large amounts of data collected by the service, which is crucial not only for ensuring the performance of a given service but also for managing its associated costs - an increasingly important concern for most enterprises.
2022. New Relic enters the security market with its new vulnerability management service
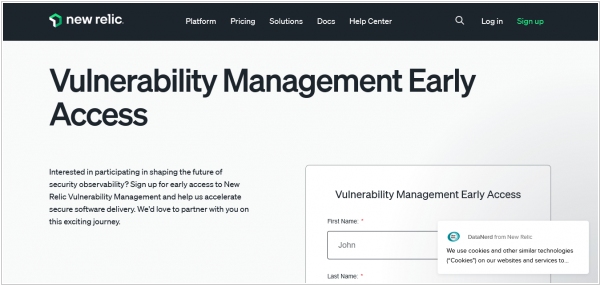
New Relic, renowned for its observability platform, has ventured into the security market by unveiling a new vulnerability management service. Aptly named New Relic Vulnerability Management, this service consolidates data from both New Relic's native vulnerability detection system and third-party tools. It offers a unified solution for security, DevOps, SecOps, and SRE teams to monitor their software stack for vulnerabilities. The company emphasizes that one of its key advantages is the seamless integration with third-party security tools. This capability enables teams to prioritize security risks effectively, considering the overwhelming number of potential risks, and the service assists in identifying the necessary actions to address and mitigate these risks.
2022. New Relic launches its new infrastructure monitoring experience
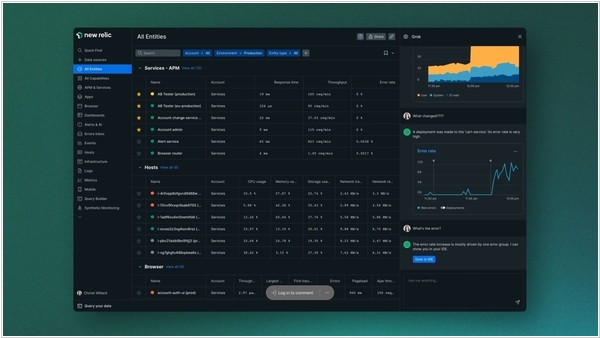
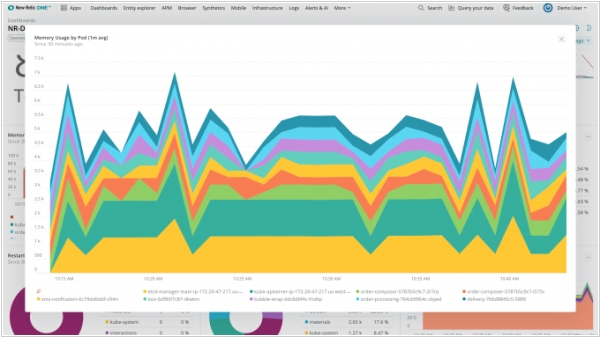
In the year 2020, New Relic introduced its New Relic One platform, aiming to consolidate the various individual solutions developed by the company over the years into a unified framework. Building upon this foundation and leveraging its NRDB data storage system, New Relic enhanced its offerings by incorporating advanced features such as enhanced network monitoring, a tool for monitoring and tracking ML model performance, and error tracking capabilities. Today, the company is finalizing one of the remaining components of this initiative by making its new infrastructure monitoring experience widely available. This solution is specifically designed to assist DevOps, SRE, and ITOps teams in monitoring their infrastructure and promptly resolving issues across public, private, and hybrid cloud environments. New Relic users can now access this new solution.
2020. New Relic acquires Kubernetes observability platform Pixie Labs
New Relic, a publicly traded company specializing in monitoring and observability platforms, has completed the acquisition of Pixie Labs, a Kubernetes observability platform. Despite the acquisition, Pixie Labs will retain its brand and product, enabling New Relic to expand its platform capabilities to the edge. Pixie Labs initially focused on offering observability for cloud-native workloads operating on Kubernetes clusters. While most similar tools cater to operators and IT teams, Pixie Labs aimed to develop a tool specifically tailored for developers' preferences. By utilizing eBPF, a relatively recent method of extending the Linux kernel, the Pixie platform can gather data directly from the source without requiring an agent.
2020. New Relic is changing its pricing model to encourage broader monitoring
In the field of monitoring, it's common practice to incur fees for monitoring each new instance. This approach can result in significant costs if you have a high level of activity within a month. As a result, many organizations choose to limit their monitoring scope to manage expenses. However, New Relic aims to revolutionize this paradigm by introducing a user-based payment model that includes a smaller, more affordable data component. In addition, the company is streamlining its product offerings to encourage customers to monitor everything instead of selectively choosing what to monitor based on cost considerations. By adopting this approach, organizations can gain comprehensive insights without worrying about exorbitant monitoring bills.
2019. Zabbix 4.2 adds built-in support of Prometheus data collection
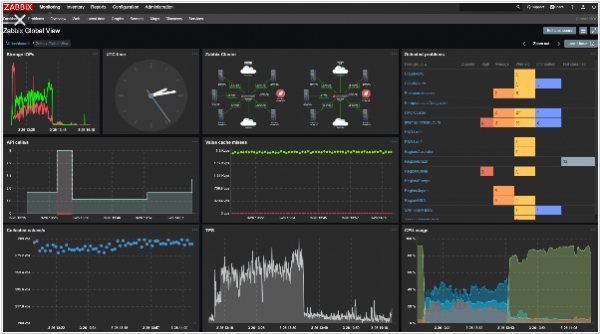
Zabbix Team has recently unveiled the launch of Zabbix 4.2. This latest version introduces a comprehensive monitoring system equipped with cutting-edge features, including data collection and processing, distributed monitoring, real-time problem and anomaly detection, alerting and escalations, visualization, and more. Zabbix 4.2 significantly enhances data collection capabilities, supporting diverse methods such as push and pull from various sources like JMX, SNMP, WMI, HTTP/HTTPS, RestAPI, XML Soap, SSH, Telnet, agents, scripts, and more. Notably, the integration with Prometheus has been added as a new feature, allowing native support for the PromQL language. Additionally, the utilization of dependent metrics empowers the Zabbix team to efficiently gather a vast amount of Prometheus metrics. By making a single HTTP call, all the required data can be retrieved and subsequently reused for relevant dependent metrics.
2014. Mobile analytics startup New Relic is now a billion-dollar company

New Relic, a provider of app-monitoring services on a SaaS basis, has experienced a successful debut in the stock market, with its first day of trading propelling it to a billion-dollar valuation. The closing share price exceeded expectations, reaching 47 percent higher than the initial offering price of $23.00 per share. This surge in value places the company's worth at approximately $1.5 billion. New Relic specializes in delivering a SaaS Software Analytics Platform, which encompasses Application Performance Management and Real User Monitoring for web applications deployed in Cloud and Data Centers, supporting various programming languages such as Ruby, Java, .NET, Python, PHP, and Node.js. Additionally, New Relic provides mobile monitoring solutions for iOS and Android applications. As the company enters the new year, it is focused on maintaining its momentum and likened its achievements to that of a football player making it to the big leagues.
2014. Application-monitoring platform provider New Relic files for an IPO
New Relic, an application-monitoring startup, has officially filed for an initial public offering, according to recent reports. In their filing, the company disclosed a revenue of $63.2 million for the year 2014, surpassing the previous year's figure of $29.7 million. New Relic, established in 2007, introduced its inaugural product in 2008. In early October, the startup acquired Ducksboard, a Barcelona-based startup, which grants New Relic the capability to integrate with diverse cloud services, consolidate the data, and produce a comprehensive dashboard. Furthermore, New Relic launched its highly anticipated real-time analytics service called Insights in July. Allegedly, this service can extract even more information from the vast amount of data collected by the New Relic platform. Despite competition from other application analytics startups like AppDynamics, ThousandEyes, and AppNeta, New Relic remains determined to make its mark in the industry.