|
Google Analytics vs Zoho Analytics
May 28, 2023 | Author: Michael Stromann
40
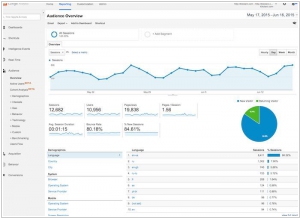
Google Analytics lets you measure your advertising ROI as well as track your Flash, video, and social networking sites and applications. Google Analytics shows you the full customer picture across ads and videos, websites and social tools, tablets and smartphones. That makes it easier to serve your current customers and win new ones.
4
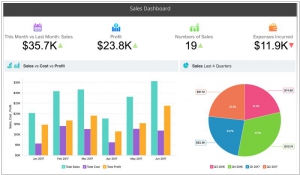
Zoho Analytics (previously, Zoho Reports) is a self-service BI and data analytics software that lets you create visually appealing data visualizations and insightful dashboards in minutes.
Google Analytics and Zoho Analytics are both powerful analytics platforms that provide valuable insights into website and business data. However, they differ in terms of features, target audience, and integration capabilities.
Google Analytics is a widely used web analytics tool that offers comprehensive data tracking and reporting for websites and mobile apps. It provides detailed information about website traffic, user behavior, conversions, and marketing campaigns. Google Analytics integrates seamlessly with other Google products and offers advanced features like goal tracking, e-commerce tracking, and audience segmentation. It is suitable for businesses of all sizes and focuses primarily on website and app analytics.
Zoho Analytics, on the other hand, is a comprehensive business intelligence and analytics platform that covers a broader range of data sources and analytics requirements. It allows users to connect and analyze data from various sources such as databases, spreadsheets, cloud storage, and third-party applications. Zoho Analytics offers advanced reporting capabilities, data visualization tools, and custom dashboards. It is suitable for businesses that require more in-depth analytics beyond just website data, and it caters to a wider range of industries and use cases.
See also: Top 10 Business Intelligence software
Google Analytics vs Zoho Analytics in our news:
2021. Zoho Analytics 5.0 uses AI and ML to assist you in getting insights from your data
Zoho has introduced an updated version of its self-service BI & analytics platform, Zoho Analytics. This enhanced version now incorporates Zoho DataPrep, a cloud-based service that augments data preparation and management capabilities. Additionally, Zoho Analytics Embedded BI empowers independent software vendors (ISVs) and developers to seamlessly integrate Zoho Analytics into their own product or solution offerings. The introduction of Zoho Analytics Marketplace enables partners and third-party vendors to create analytics applications on top of Zoho Analytics and market them through the Zoho Marketplace. The updated version also includes Zoho Analytics Native Apps, which are applications developed by Zoho and natively embedded within third-party apps, making them readily available in their respective marketplaces. With the integration of the AI assistant Zia, users can engage in natural language conversations with Zia, eliminating the need to learn complex SQL querying. This allows users to obtain relevant reports and receive the necessary answers in a conversational manner.
2020. Google Analytics 4 allows to combine website and mobile app statistics
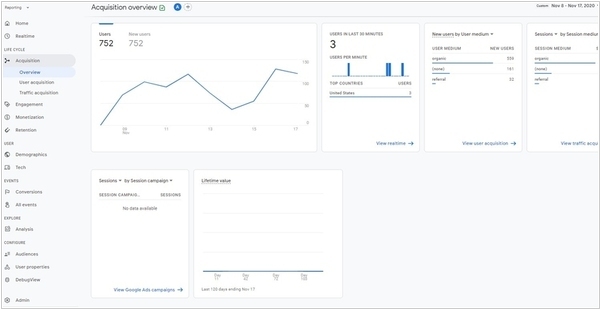
Google has introduced a major update to its website analytics platform, Google Analytics 4. The key highlight of this update is the inclusion of a new resource type called App + Web. This feature allows users to combine data from both websites and mobile applications, enabling the creation of unified reports for comprehensive analysis. The functionality of analytics tools has been significantly revamped, with improved visualization of user behavior and the adoption of a new model called "Event + Parameter." Notably, the updated platform now offers enhanced capabilities for online stores. Users can create user groups based on the likelihood of placing an order or leaving the website within the next seven days. It is important to note that the option to continue using the previous version, Universal Analytics (UA), is still available. Users have the flexibility to work with both Universal Analytics and Google Analytics 4 simultaneously by creating new resources with dual analytics capabilities (UA + GA4). This dual approach is designed to accommodate users who may find exclusive use of the new tool less convenient in certain scenarios.
2018. Zoho Analytics got AI-powered Assistant
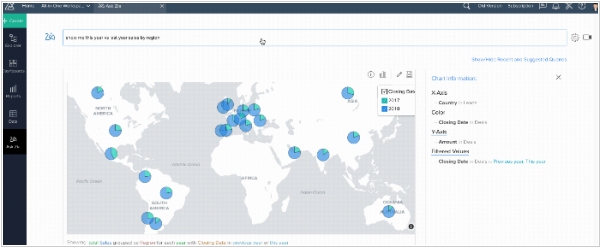
Zoho Analytics now incorporates Zia, an AI-powered intelligent assistant. With Zia, you can effortlessly ask questions in natural language, such as "Provide me with support tickets received this month, categorized by product and region" or "Give me sales data by country and channel." Zia translates these inquiries into complex SQL queries in the backend and suggests multiple relevant reports. You can save the most suitable suggestion directly as a report. Additionally, the new version of Zoho Analytics streamlines data analysis across various applications, enabling the creation of interactive reports and dashboards. It accurately predicts future trends based on historical data. Furthermore, Zoho Analytics introduces seven new connectors for popular business apps. Each connector includes over 100 pre-built reports and KPI dashboards specific to different domains, offering immediate benefits to users.
2016. Google Analytics adds automated insights

Google Analytics has introduced enhanced functionality on iOS and Android platforms, allowing users to easily identify crucial trends within their data. On the Assistant screen, users will now have access to automatically generated insights. For instance, if there is a sudden surge in new users on your website or app, Google Analytics will prominently highlight this information and provide details regarding the source of these new users. Likewise, for e-commerce companies, it can pinpoint the products experiencing the most significant increase in sales. Although Google Analytics was already tracking this information, it is now presented in a concise and easily digestible card format. This enhancement enables businesses to swiftly access the relevant information without the need to navigate through multiple pages, reducing the chances of overlooking important data changes.
2016. New Google Analytics app improves user experience
The most recent update of the Google Analytics app (version 3.0) introduces several features inspired by chat platforms. Google has streamlined the app's navigation, resulting in a cleaner interface that enhances the visibility of reports. Metrics and dimensions are now displayed within scorecards, which bear a resemblance to the widgets found in Google Analytics dashboards. These scorecards present a concise overview of the top dimensions within a specific report. By utilizing familiar tablet and smartphone user behaviors, such as swiping, users can easily navigate to their desired dimensions. The condensed listing of scorecards also facilitates the effortless discovery and bookmarking of reports.
2015. Google Analytics adds Calculated Metrics
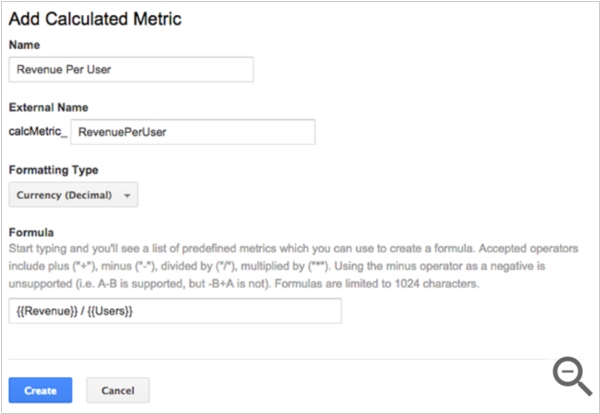
Google has introduced a new feature in Google Analytics called Calculated Metrics. This feature enables users to create custom metrics based on existing metrics within Google Analytics. It eliminates the need to navigate away from the report, streamlining the process of performing calculations. Essentially, Calculated Metrics serves as a convenient tool for adding compound metrics that frequently arise in business intelligence discussions. For instance, an e-commerce retailer could generate a currency conversion metric by multiplying the Revenue metric from Google Analytics reports with the current conversion rate. To access Calculated Metrics, users can find it in the admin panel under the view column.
2014. Google Analytics is available on iPhone
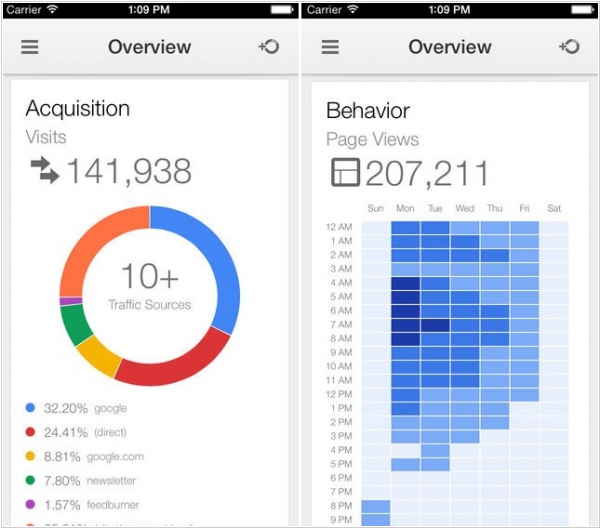
After more than two years of launching Google Analytics for Android, Google has now introduced a version of Google Analytics specifically designed for the iPhone. This app enables users to conveniently monitor their website analytics, including real-time visitor reports, directly from their smartphones. In addition to providing real-time and time-based reports, the app offers insights into user behaviors, conversions, and more. The user interface (UI) of the app aligns with the aesthetic of other Google apps available for iOS. Moreover, the app leverages the sign-in capabilities of Gmail, Google+, and the standard Google app for iOS. It's important to note that Google Analytics for iPhone is currently not optimized for iPad, but there is hope that future updates will include support for iPads.
2014. Google Analytics gets brand new E-Commerce section
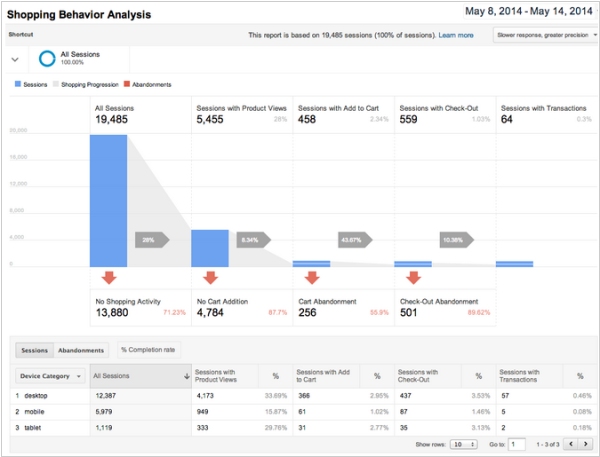
Google is introducing a comprehensive overhaul of its Google Analytics E-commerce, focusing on delivering insights throughout the entire customer journey, going beyond just the purchase stage. The updated version includes new metrics such as product detail views, 'add to cart' actions, clicks on internal campaigns, the effectiveness of internal merchandising tools, the checkout process, and the final purchase. Additionally, users can now create audience segments directly from funnel reports to analyze user actions, including cart and product page abandons. Funnels are accessible at the device category level, as depicted in the screenshot below.