|
Chart.io vs Zoomdata
June 10, 2023 | Author: Michael Stromann
1
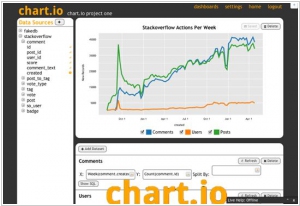
Create interactive charts and perfect dashboards through an intuitive drag and drop interface. Switch from basic tables to sophisticated data visualizations in a single click. Powerful filters let you slice and dice your data, and you can drill down into most charts without configuring a thing.
4
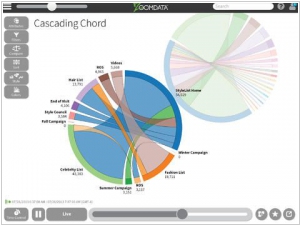
Next Generation Big Data Analytics, Learn how to connect to Hadoop, Apache Solr, Stream Process billions of records, and visualize them using D3. Search through billions of records in seconds. Use filters and faceted search to narrow results. Replace lengthy/time consuming queries
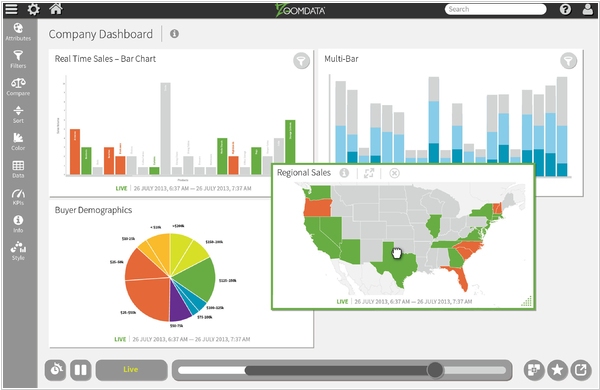
Chartio and Zoomdata are both data visualization platforms, but they differ in their approach, features, and target users. Chartio is a cloud-based data visualization tool that emphasizes self-service analytics and simplicity. It offers an intuitive drag-and-drop interface, interactive dashboards, and the ability to connect to a wide range of data sources. Chartio focuses on making data exploration and visualization accessible to non-technical users, enabling them to easily create charts and dashboards without coding or complex configurations. It is well-suited for small to medium-sized businesses and teams that prioritize ease of use and quick insights. Zoomdata, on the other hand, is a data visualization platform designed for handling large and complex datasets, real-time analytics, and big data sources. It specializes in providing fast and interactive visualizations, data exploration capabilities, and real-time data connectivity. Zoomdata targets industries that require real-time analytics, such as finance, telecommunications, and e-commerce. Its strength lies in its ability to handle high-volume, streaming, and time-sensitive data, making it suitable for organizations with advanced data needs and technical expertise.
See also: Top 10 Business Intelligence software
See also: Top 10 Business Intelligence software
Chart.io vs Zoomdata in our news:
2014. Zoomdata wants to disrupt Business Intelligence market
The highly competitive Business Intelligence (BI) market has seen a disruptor emerge with Zoomdata securing $17 million in Series B funding to drive its mission forward. In contrast to BI competitors like Tableau and Qlik, which originated from the realm of SQL and data warehouses, Zoomdata takes a more contemporary approach to modern data analytics. Built specifically to handle today's platforms such as Hadoop, Spark, and NoSQL, Zoomdata sets itself apart by being designed from the ground up with these technologies in mind. One standout feature of Zoomdata is its ability to stream data in a manner akin to video playback, enabling users to navigate back and forth in time, much like scrubbing a video. This unique capability proves invaluable when working with data, as it allows users to observe the transformation of graphs and visualizations over time, providing crucial insights into evolving trends and patterns. With its innovative approach and powerful features, Zoomdata aims to reshape the BI landscape and deliver cutting-edge analytics solutions.