|
Top 10 Website Statistics and Web Analytics platforms
February 03, 2024 | Editor: Sandeep Sharma
17
Website statistics and web analytics platforms provide businesses with valuable insights into the performance and behavior of their website visitors. These platforms collect and analyze data on metrics such as traffic sources, visitor demographics, page views, conversion rates, and user engagement, enabling businesses to make data-driven decisions, optimize their website, and improve the overall user experience to drive better results and achieve their online goals.
1
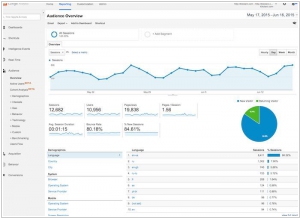
Google Analytics lets you measure your advertising ROI as well as track your Flash, video, and social networking sites and applications. Google Analytics shows you the full customer picture across ads and videos, websites and social tools, tablets and smartphones. That makes it easier to serve your current customers and win new ones.
2
Any question you can ask about your data, Mixpanel can answer. There are many metrics that measure engagement; page views are not one of them. Make your product better by measuring actions, not page views. Mixpanel's power lies in giving you the ability to learn more from your data by being able to ask increasingly important and complex questions. Most analytics products limit insights to basic trend lines, showing for example "number of homepage visits" over time. Mixpanel goes further by enabling you to ask more of your data.
3
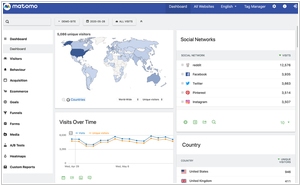
Google Analytics alternative that protects your data and your customers' privacy. Take back control with Matomo – a powerful web analytics platform that gives you 100% data ownership. Provides open-source On-Premise and SaaS options.
4
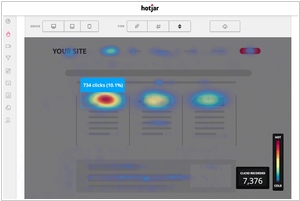
Website Heatmaps and Behavior Analytics Tool. Understand how users behave on your site, what they need, and how they feel, fast.
5
Simple and privacy-friendly Google Analytics alternative. Plausible is lightweight and open source web analytics. No cookies and fully compliant with GDPR, CCPA and PECR. Made and hosted in the EU, powered by European-owned cloud infrastructure
6
Product Analytics software. Give your teams a self-service digital analytics platform to understand your users, drive conversions, and increase engagement, growth and revenue.
7
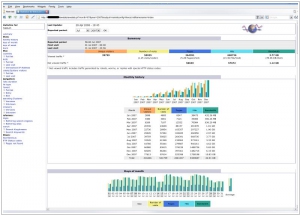
AWStats is a free powerful and featureful tool that generates advanced web, streaming, ftp or mail server statistics, graphically. This log analyzer works as a CGI or from command line and shows you all possible information your log contains, in few graphical web pages.
8

A Crazy Egg heatmap lets you collect more than 88% of the data you would using a traditional eye-tracking process. At a fraction of the price. With no hardware. Almost no IT involvement. And no strings attached. A heatmap is an easy way to understand what users want, care about and do on your site by visually representing their clicks - which are the strongest indicators of visitor motivation and desire.
9
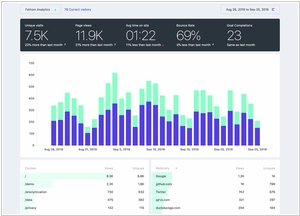
Privacy-focused website analytics without compromise. Fathom is a Google Analytics alternative that doesn’t compromise visitor privacy for data. We revolutionized website analytics by making them easy to use and respectful of privacy laws (like GDPR and more).
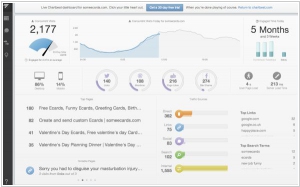
10
Clarity is a free, easy-to-use tool that captures how real people actually use your site. Setup is easy and you'll start getting data in minutes.
12
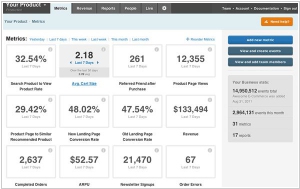
KISSmetrics takes all the data you’re collecting and ties it to real people. Every last piece gets connected to a real person. All of it. It doesn’t matter if people bounce around between different browsers and devices. Or even if it takes them 6 months to come back. You’ll see what real people do. You get all the reports that you’ve come to expect from analytics. Funnels, cohorts, revenue, metrics, it’s all there. You’ll also get the one thing you won’t be able to live without: people.
13
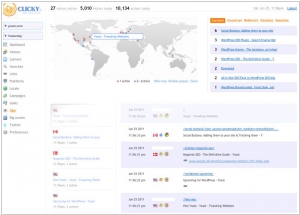
Clicky Web Analytics enables bloggers and small websites to get insights and live information about their online visitors. Clicky lets you see every visitor and every action they take on your web site, with the option to attach custom data to visitors, such as usernames or email addresses. Analyze each visitor individually and see their full history.
14
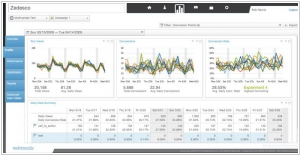
Webtrends offers a portfolio of digital solutions that help brands understand consumer behaviors and enable them to act on those insights in the very moment they need to act. Utilizing advanced big data analytics, Webtrends solutions provide a consistent customer experience across all digital channels on any device the customer uses, helping brands remain connected and relevant to their customers, increase productivity and maximize yield on investments.
15
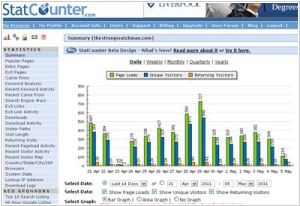
Free Invisible Web Tracker. Use StatCounter to monitor actual human activity in real-time. StatCounter can be used 100% free of charge - no credit card required. Straightforward install process - add a few lines of code to your site
16
Chartbeat provides real-time analytics for publishers and media content creators. Get live real-time data about your website performance. Whether it's incorporating loyalty insights into your morning meetings or relying on one-glance homepage stats, fire up your strategy with data designed specifically for media sites.
17
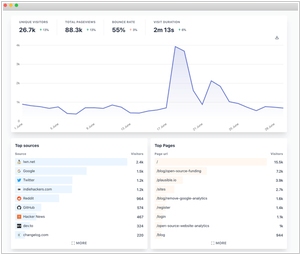
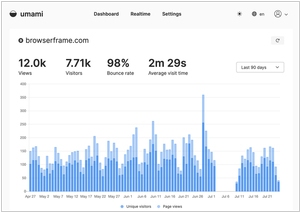
Web Analytics without the confusion. Get the key website metrics you check every day, without the complexity and learning curve of tools like Google Analytics.
18
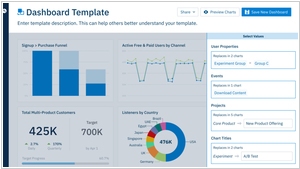
Customer Journey Analytics. Track everything that your users do. Acquire and retain more customers with advanced analytics.
Latest news about Website Statistics and Web Analytics platforms
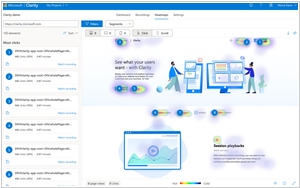
2020. Microsoft launched website analytics platform Clarity
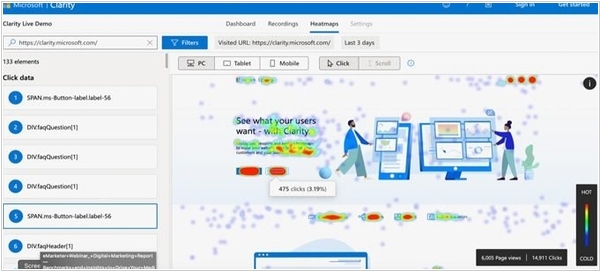
Microsoft has launched Clarity, an innovative dashboard that assesses website engagement and provides insights for enhancing the user interface (UI) and overall online customer experience. Clarity's user interface is designed with a simplicity similar to existing social media dashboards, resembling Google Analytics with its division into four key segments. However, Clarity distinguishes itself by placing greater emphasis on heatmap analysis. The two primary analysis panels in Clarity are Heatmap and Recording, offering comprehensive insights into user interactions. The Heatmap panel presents two views: click maps, which visualize the general areas where page visitors tend to click, and scroll maps, which illustrate how users navigate up and down a given page. The Dashboard panel summarizes UI and page performance metrics, while the Settings panel enables users to make further adjustments to their accounts. Clarity's focus on heatmap analysis sets it apart as a valuable tool for website optimization and enhancing the user experience.
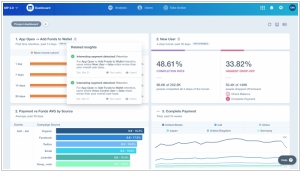
2020. Google Analytics 4 allows to combine website and mobile app statistics
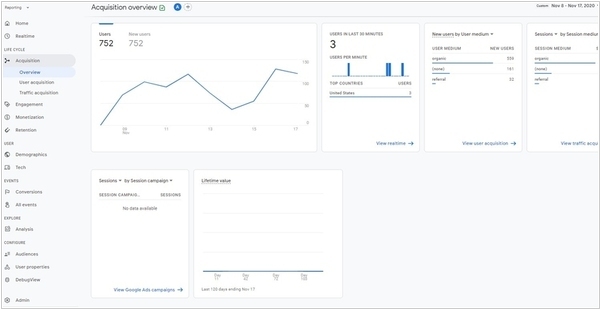
Google has introduced a major update to its website analytics platform, Google Analytics 4. The key highlight of this update is the inclusion of a new resource type called App + Web. This feature allows users to combine data from both websites and mobile applications, enabling the creation of unified reports for comprehensive analysis. The functionality of analytics tools has been significantly revamped, with improved visualization of user behavior and the adoption of a new model called "Event + Parameter." Notably, the updated platform now offers enhanced capabilities for online stores. Users can create user groups based on the likelihood of placing an order or leaving the website within the next seven days. It is important to note that the option to continue using the previous version, Universal Analytics (UA), is still available. Users have the flexibility to work with both Universal Analytics and Google Analytics 4 simultaneously by creating new resources with dual analytics capabilities (UA + GA4). This dual approach is designed to accommodate users who may find exclusive use of the new tool less convenient in certain scenarios.
2018. Piwik rebrands as Matomo
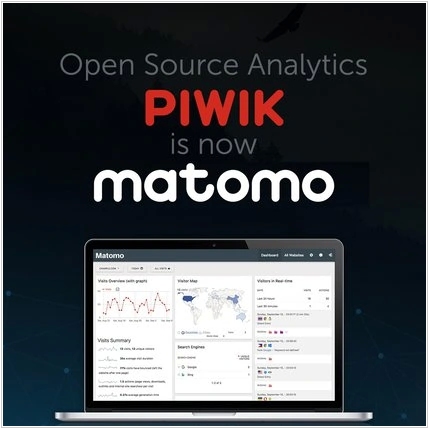
After a decade of developing Piwik and achieving remarkable success in creating the leading open-source analytics software that empowers users to have complete control over their data, the developers are embarking on a new chapter. As a result, the community project known as Piwik will now be known as Matomo. This change in name is the only modification; everything else remains unchanged. The developers' commitment to privacy has proven to be visionary, especially in light of the increasing global emphasis on privacy and the imminent introduction of privacy regulations in Europe. With the highly anticipated release of Matomo 4.0 planned for this year, new privacy protections will equip users with the necessary tools to comply with GDPR privacy laws. Matomo will continue to evolve in harmony with these regulations, guided by a clear and focused vision.
2016. Google Analytics adds automated insights

Google Analytics has introduced enhanced functionality on iOS and Android platforms, allowing users to easily identify crucial trends within their data. On the Assistant screen, users will now have access to automatically generated insights. For instance, if there is a sudden surge in new users on your website or app, Google Analytics will prominently highlight this information and provide details regarding the source of these new users. Likewise, for e-commerce companies, it can pinpoint the products experiencing the most significant increase in sales. Although Google Analytics was already tracking this information, it is now presented in a concise and easily digestible card format. This enhancement enables businesses to swiftly access the relevant information without the need to navigate through multiple pages, reducing the chances of overlooking important data changes.
2016. New Google Analytics app improves user experience

The most recent update of the Google Analytics app (version 3.0) introduces several features inspired by chat platforms. Google has streamlined the app's navigation, resulting in a cleaner interface that enhances the visibility of reports. Metrics and dimensions are now displayed within scorecards, which bear a resemblance to the widgets found in Google Analytics dashboards. These scorecards present a concise overview of the top dimensions within a specific report. By utilizing familiar tablet and smartphone user behaviors, such as swiping, users can easily navigate to their desired dimensions. The condensed listing of scorecards also facilitates the effortless discovery and bookmarking of reports.
2015. Google Analytics adds Calculated Metrics
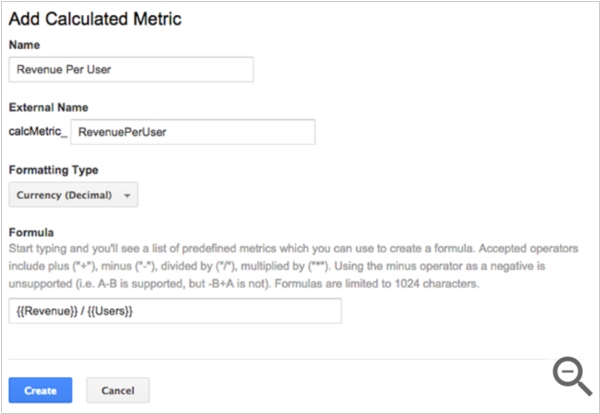
Google has introduced a new feature in Google Analytics called Calculated Metrics. This feature enables users to create custom metrics based on existing metrics within Google Analytics. It eliminates the need to navigate away from the report, streamlining the process of performing calculations. Essentially, Calculated Metrics serves as a convenient tool for adding compound metrics that frequently arise in business intelligence discussions. For instance, an e-commerce retailer could generate a currency conversion metric by multiplying the Revenue metric from Google Analytics reports with the current conversion rate. To access Calculated Metrics, users can find it in the admin panel under the view column.
2015. Website personalization service Optimizely raises $58M
Optimizely, the renowned company synonymous with A/B testing, has secured $58 million in funding. While Optimizely is widely recognized for its tools that enable customers to test different variations of their websites and determine the most effective one, it has been expanding its horizons. The company ventured into new territories by introducing Optimizely for iOS last year, followed by the recent launch of Optimizely Personalization. As a result, Optimizely has established itself as a leading service for optimizing websites (according to Alexa) and mobile apps (according to MixRank). Esteemed customers such as CNN, Microsoft, and Virgin America have entrusted Optimizely with their optimization needs. Despite the existence of numerous A/B testing tools in the market, Optimizely stands out by prioritizing the development of "best in class products" and fostering integrations with a diverse range of partners.
2015. A/B website testing service Optimizely to focuse on personalized experience
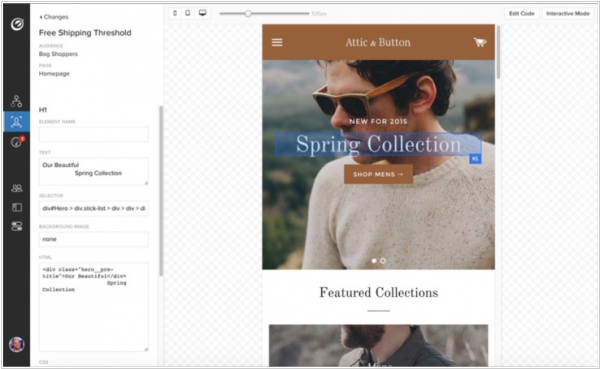
A/B website testing tool Optimizely extends its capabilities beyond testing by introducing a new product called Optimizely Personalization, enabling online publishers to deliver customized experiences to their users. The personalization features of this product can be categorized into four key areas. Firstly, there is the ability to connect data, allowing companies to utilize their customer data and integrate information from services like BlueKai, Tealium, and Lotame. Secondly, there is the functionality to discover audiences, where Optimizely suggests various audience segments that companies can target with personalized experiences. Thirdly, there is the option to optimize experiences, allowing the creation of different pages tailored to specific segments. Lastly, there is the capability to understand impact, enabling the analysis of data to determine the effectiveness of personalization in driving engagement, purchases, or any other desired outcomes.
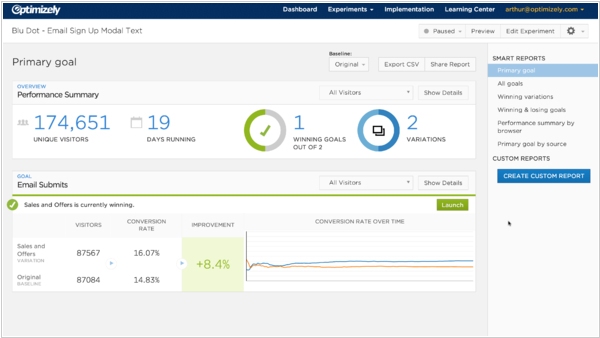
2015. Optimizely unveiled revolutionary website statistics engine

The website optimization platform Optimizely has introduced a new feature called Stats Engine, which enhances the company's experience optimization platform. This feature provides test results that are consistently valid and unrestricted by the limitations of traditional statistical analysis. Developed in partnership with statisticians from Stanford University, Stats Engine leverages innovative statistical analysis techniques. Alongside the platform's proprietary algorithms, it enables customers to interpret and take action on data with greater speed and confidence than ever before, according to the company.
2014. Chartbeat wants web analytics standards to be open
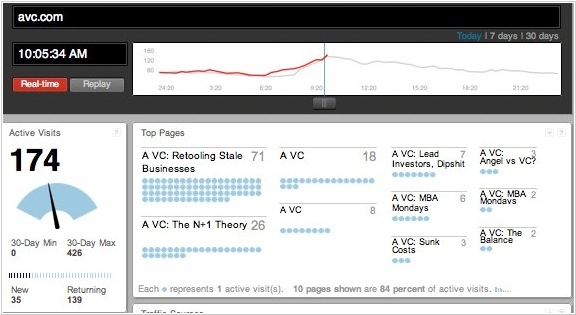
The real-time web analytics service, Chartbeat, has taken a transparent approach by publicly sharing all the metrics, standards, and measurement methods it employs internally. This includes providing a comprehensive breakdown of the weaknesses and limitations associated with these practices. Tony Haile, the CEO of Chartbeat, believes that the web measurement and analytics industry still heavily relies on secretive tactics and deceptive practices. To combat this, he has chosen to disclose his company's entire measurement process and methods, with the hope that others will follow suit. Traditionally, measurement and analytics companies, as well as the media and publishing companies that constitute their primary clientele, have kept their methodologies private to a large extent. By taking a different approach, Chartbeat aims to promote transparency and encourage a more open sharing of practices within the industry.
2014. StatCounter launched apps for iOS and Android
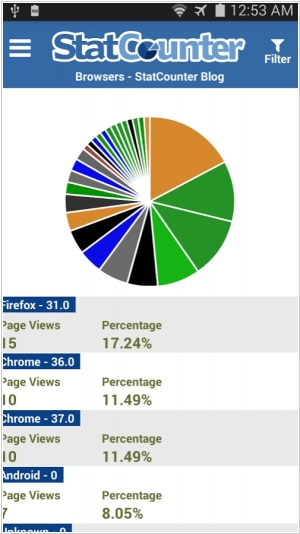
The popular website analytics service, StatCounter, has introduced mobile applications for both iOS and Android platforms. With these apps, users can conveniently access a range of familiar StatCounter reports by simply logging in with their username and password. The app allows you to analyze traffic trends by comparing the current week to the previous week, explore recent visitors, examine your most visited pages, track the sources of your traffic, and much more. While the app is free to use, it does include in-app advertisements. However, you have the option to remove these ads by upgrading your StatCounter account to a paid plan at any time.
2014. Google Analytics is available on iPhone
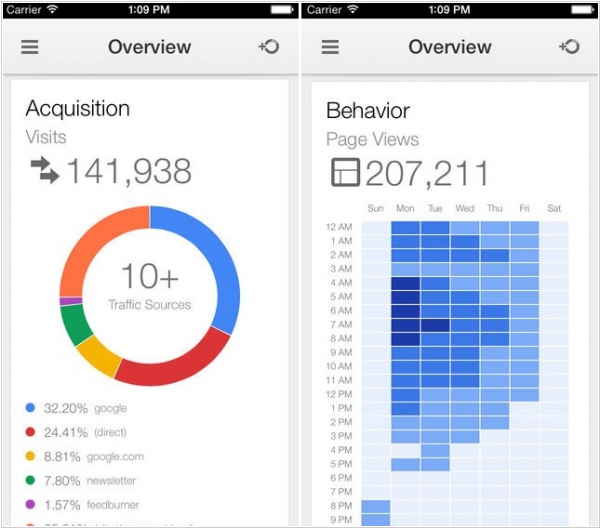
After more than two years of launching Google Analytics for Android, Google has now introduced a version of Google Analytics specifically designed for the iPhone. This app enables users to conveniently monitor their website analytics, including real-time visitor reports, directly from their smartphones. In addition to providing real-time and time-based reports, the app offers insights into user behaviors, conversions, and more. The user interface (UI) of the app aligns with the aesthetic of other Google apps available for iOS. Moreover, the app leverages the sign-in capabilities of Gmail, Google+, and the standard Google app for iOS. It's important to note that Google Analytics for iPhone is currently not optimized for iPad, but there is hope that future updates will include support for iPads.
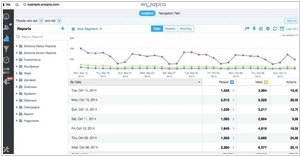
2014. Google Analytics gets brand new E-Commerce section
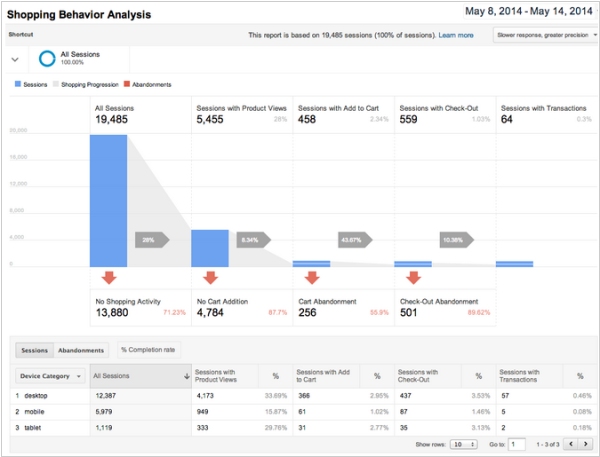
Google is introducing a comprehensive overhaul of its Google Analytics E-commerce, focusing on delivering insights throughout the entire customer journey, going beyond just the purchase stage. The updated version includes new metrics such as product detail views, 'add to cart' actions, clicks on internal campaigns, the effectiveness of internal merchandising tools, the checkout process, and the final purchase. Additionally, users can now create audience segments directly from funnel reports to analyze user actions, including cart and product page abandons. Funnels are accessible at the device category level, as depicted in the screenshot below.