|
Chart.io vs Geckoboard
May 26, 2023 | Author: Michael Stromann
1
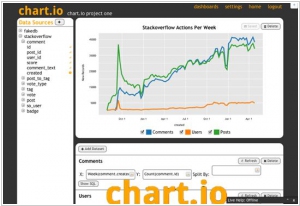
Create interactive charts and perfect dashboards through an intuitive drag and drop interface. Switch from basic tables to sophisticated data visualizations in a single click. Powerful filters let you slice and dice your data, and you can drill down into most charts without configuring a thing.
5
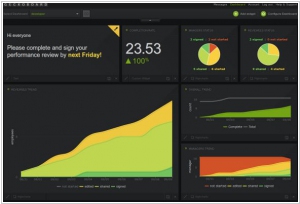
Instant visibility. Use data to make better decisions and motivate your team. Stop wasting time hunting down the data you need. Simply display your key metrics on a beautifully designed and intuitive real-time dashboard. Choose your metrics based on your current business goals. Pull in the data you need from the services you use. See your data in real-time and make informed decisions.
Chart.io and Geckoboard are both data visualization tools, but they have distinct differences in their focus, features, and target audiences.
Chart.io is primarily a business intelligence platform that specializes in data visualization and exploration. It offers features such as dashboard creation, charting options, query building, and data collaboration. Chart.io focuses on providing a user-friendly interface for businesses to analyze and visualize their data, connect to various data sources, and generate interactive dashboards and reports. It is commonly used by data analysts, business users, and teams seeking to gain insights from their data in a visually appealing and intuitive way.
Geckoboard, on the other hand, is a real-time dashboard platform that focuses on key performance indicators (KPIs) and data visualization for businesses. It offers pre-built widgets and integrations with various data sources, allowing users to create customizable dashboards to monitor metrics such as sales, marketing performance, customer support, and more. Geckoboard emphasizes simplicity, ease of use, and real-time data updates to keep teams informed and aligned with their business goals. It is commonly used by teams and organizations across different departments to track and display important metrics in a centralized and visually engaging manner.
See also: Top 10 Mobile App Analytics platforms