|
AppDynamics vs Prometheus
April 09, 2019 | Author: Michael Stromann
12
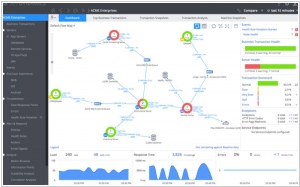
Cisco's AppDynamics is an application performance management and IT operations analytics software. Get real-time insights and transform your app performance with our Application Performance Management to drive business outcomes.
24
An open-source monitoring system with a dimensional data model, flexible query language, efficient time series database and modern alerting approach.
AppDynamics and Prometheus are both popular monitoring and observability tools used in the field of IT operations and application performance management, but they have some key differences:
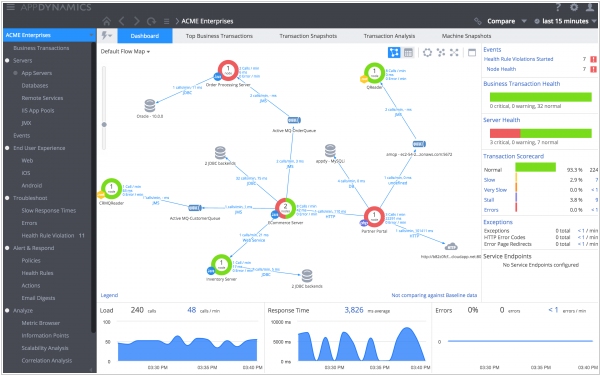
Approach to Monitoring: AppDynamics is a commercial, enterprise-grade application performance monitoring (APM) solution that provides end-to-end visibility into applications and infrastructure, with features such as real-time monitoring, automatic root cause analysis, and deep dive diagnostics. It provides a comprehensive set of monitoring capabilities with a focus on application performance, transaction tracing, and business metrics. Prometheus, on the other hand, is an open-source monitoring and alerting toolkit that is more focused on collecting and storing time-series data, primarily for monitoring and alerting on infrastructure and application metrics.
Data Model and Querying: AppDynamics uses a proprietary data model and provides a rich set of built-in metrics, dashboards, and visualizations for monitoring applications and infrastructure. It also offers advanced features like anomaly detection, machine learning-based analytics, and correlation across distributed systems. Prometheus, on the other hand, uses a pull-based model for collecting metrics, and it stores metrics as time-series data with a flexible query language (PromQL) for querying and analyzing data. Prometheus follows a "pull" model, where it periodically scrapes data from monitored targets, while AppDynamics typically uses an "agent" approach for collecting and sending data to the monitoring server.
Scalability and Architecture: AppDynamics is a commercial product designed for large-scale enterprise deployments and offers features like multi-tenancy, high availability, and scalability to monitor complex distributed systems. It provides a central controller that collects and processes data from various agents deployed across the infrastructure. Prometheus, on the other hand, is a self-hosted open-source solution that can be deployed on-premises or in the cloud. It follows a federated architecture where each Prometheus server collects and stores metrics independently, and data can be queried and aggregated across multiple Prometheus instances.
Alerting and Notification: Both AppDynamics and Prometheus offer alerting and notification features for detecting anomalies and triggering notifications based on predefined conditions. However, the alerting mechanisms and configurations differ between the two tools. AppDynamics provides a flexible and rule-based alerting engine that allows users to define alerts based on metrics, events, and custom conditions, with support for various notification channels. Prometheus, on the other hand, uses a separate component called "Alertmanager" for managing alerts and notifications, and it offers more fine-grained control over alerting rules and actions.
Community and Ecosystem: Prometheus is an open-source project with a large community of users and contributors, and it has a growing ecosystem of integrations, exporters, and plugins for collecting and processing metrics from various systems and technologies. AppDynamics, being a commercial product, also has a community of users and customers, but its ecosystem may be more limited compared to the open-source nature of Prometheus.
Licensing and Cost: AppDynamics is a commercial product with different licensing and pricing options, typically based on the number of monitored entities, features, and deployment options. Prometheus, being open-source, is free to use and has no licensing costs, although organizations may need to consider costs associated with hosting, deployment, and maintenance.
In summary, the main differences between AppDynamics and Prometheus include their approach to monitoring, data model and querying, scalability and architecture, alerting and notification, community and ecosystem, and licensing and cost. Organizations should carefully evaluate their monitoring requirements, deployment preferences, and budget considerations when choosing between these two tools for their monitoring and observability needs.
See also: Top 10 IT Monitoring software
AppDynamics vs Prometheus in our news:
2019. Zabbix 4.2 adds built-in support of Prometheus data collection
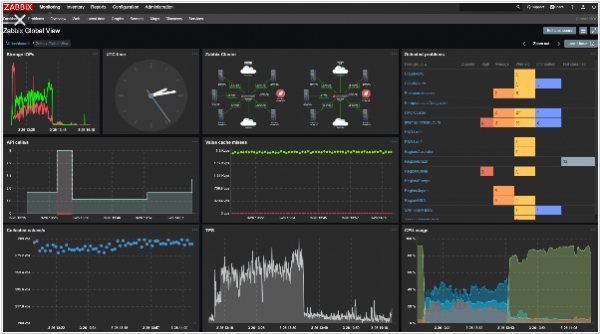
Zabbix Team has recently unveiled the launch of Zabbix 4.2. This latest version introduces a comprehensive monitoring system equipped with cutting-edge features, including data collection and processing, distributed monitoring, real-time problem and anomaly detection, alerting and escalations, visualization, and more. Zabbix 4.2 significantly enhances data collection capabilities, supporting diverse methods such as push and pull from various sources like JMX, SNMP, WMI, HTTP/HTTPS, RestAPI, XML Soap, SSH, Telnet, agents, scripts, and more. Notably, the integration with Prometheus has been added as a new feature, allowing native support for the PromQL language. Additionally, the utilization of dependent metrics empowers the Zabbix team to efficiently gather a vast amount of Prometheus metrics. By making a single HTTP call, all the required data can be retrieved and subsequently reused for relevant dependent metrics.
2017. Cisco aquired application performance management software AppDynamics
Cisco has made a significant acquisition by purchasing AppDynamics for a remarkable $3.7 billion. AppDynamics specializes in providing performance monitoring solutions for business applications, allowing customers to gain valuable insights into the inner workings of their applications. This comprehensive overview enables companies to effectively identify bottlenecks and performance issues that may hinder transactions and other actions. The primary objective is to detect and address potential issues before they escalate into major problems, sparing companies significant headaches. With this acquisition, Cisco further expands its range of offerings and provides companies with a more comprehensive stack of tools to support their business operations.
2015. AppDynamics allows to track business transaction from user to server
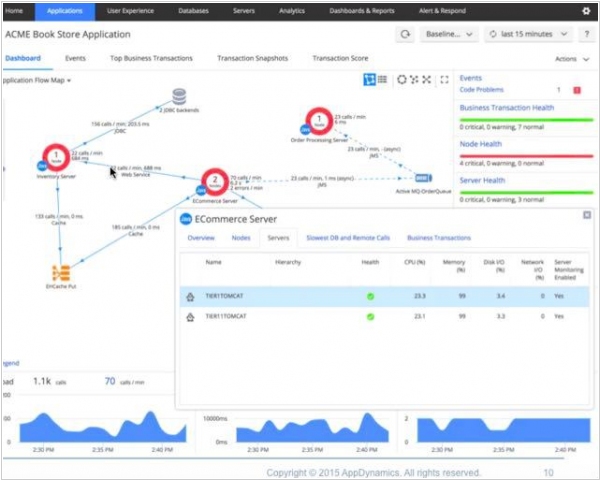
AppDynamics, a company specializing in app and website monitoring to prevent outages and facilitate efficient recovery, has announced a significant update. The latest version introduces enhanced capabilities for identifying both major and minor issues that can negatively impact user experiences on apps or websites. It specifically aims to assist customers in recognizing patterns such as multiple individuals encountering problems with the shopping cart on an eCommerce site or tracking an individual customer's 'digital journey' while utilizing a mobile app or browsing the company's website. The ultimate objective is to pinpoint performance issues at any stage of the user's interaction.
2015. Application performance management provider AppDynamics raises $158M
San Francisco-based company AppDynamics has successfully concluded a funding round, raising a total of $158 million. The round was led by General Atlantic and Altimeter Capital. AppDynamics specializes in developing software that monitors the performance of business applications. It competes with established firms like IBM, as well as newer players such as New Relic, which went public in December of the previous year and has demonstrated relatively consistent stock performance since then. (New Relic, which secured $214 million in venture funding, currently boasts a market capitalization of $1.8 billion.) AppDynamics had previously secured approximately $206 million in debt and equity financing, which includes a $120 million round—comprised of $70 million in equity and $50 million in debt—that concluded in July of the preceding year.